

HOT TOPICS LIST
- MACD
- Fibonacci
- RSI
- Gann
- ADXR
- Stochastics
- Volume
- Triangles
- Futures
- Cycles
- Volatility
- ZIGZAG
- MESA
- Retracement
- Aroon
INDICATORS LIST
LIST OF TOPICS
PRINT THIS ARTICLE
by Chaitali Mohile
The stock of Kellogg Co. looks as healthy as its products.
Position: N/A
Chaitali Mohile
Active trader in the Indian stock markets since 2003 and a full-time writer. Trading is largely based upon technical analysis.
PRINT THIS ARTICLE
CHART ANALYSIS
Kellogg Co. Hitting New High
03/02/16 11:16:11 AMby Chaitali Mohile
The stock of Kellogg Co. looks as healthy as its products.
Position: N/A
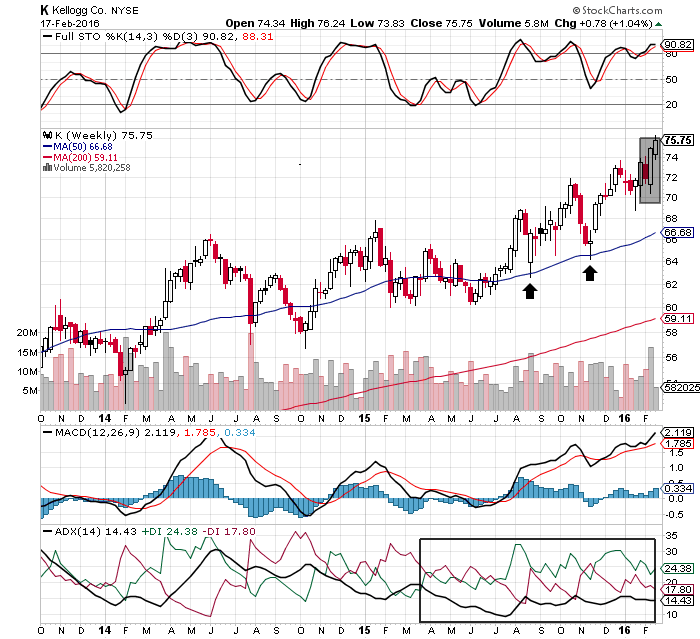
| Kellogg Co. (K) has rushed to its 52-weeks high, ignoring all the current turmoil in the global financial market. This stock has strongly established support on the ascending 50-day moving average (MA). Although in 2014 and 2015 this support was challenged consistently, the bullish sentiments helped the stock to rally higher with this robust technical support. We can see in Figure 1, the jittery average directional index (ADX)(14) moved below 15 levels with unstable selling pressure (red line) and buying pressure (green line). This could be one of the reasons for the volatile price rally that retraced to test the 50-day MA support. |
|
| Figure 1. Weekly Chart Of Kellogg Co (K). The bullish engulfing candlestick pattern has recently formed. |
| Graphic provided by: StockCharts.com. |
| |
| However, in late 2015, K surged with an increased bullish pressure. The two arrows marked on the price chart in Figure 1 shows the long lower shadows of a bullish candle and a doji candlestick. This suggests that the stock intends to ascend with higher lows. The moving average convergence/divergence (MACD)(12,26,9) formed a bullish crossover in positive territory and moved upwards. The full stochastic(14,3,3) showed a bullish momentum in the rally as it surged in mid-2015 from an oversold area. Thus, K geared itself for the stable bullish move. |
| The last few weeks were highly promising for the stock. The grey block in Figure 1, shows three long white candles and a sandwiched red candle. A bullish engulfing candlestick pattern is formed by the red candle followed by the big bullish candle on the weekly chart. This reflects that the bullish trend reversal rally is underway for K. The bullish stochastic oscillator and the positive MACD(12,26,9) are likely to help the stock sustain at its 52-week high. |
|
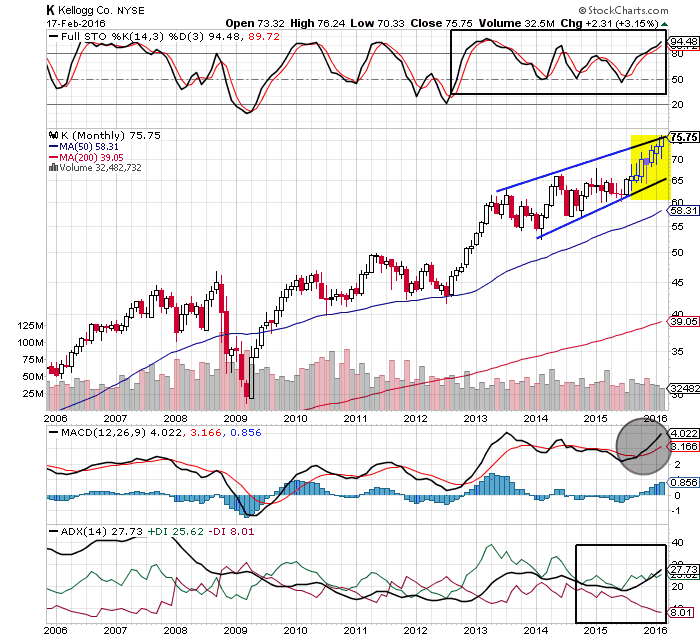
| Figure 2. Monthly Chart Of Kellogg Co (K). The yellow block shows the cluster of bullish candles with marginal upper and lower shadows. |
| Graphic provided by: StockCharts.com. |
| |
| The monthly chart in Figure 2 is indicating healthy signals for the long-term investment. The stock is moving within a wide range. Though the formation looks like a rising wedge, the trendlines would take a long time to converge. Currently, an uptrend indicated by the ADX(14) is developing at 27 levels. The positions of the ADX line and the positive directional index (green line) are stable, suggesting a strong upwards price movement. An overbought full stochastic(14,3,3) is zigzagging in a bullish region, and the MACD(12,26,9) is comfortable above its zero line. |
| Therefore, these bullish notes would reduce the impact of global volatility on the stock. The trendlines support/resistance technique can be applied to identify a breakout possibility for K. To conclude, K is a healthy stock for trading as well as investment. Since the financial markets across globe are uncertain, buying small quantity of stock is recommended. |
Active trader in the Indian stock markets since 2003 and a full-time writer. Trading is largely based upon technical analysis.
| Company: | Independent |
| Address: | C1/3 Parth Indraprasth Towers. Vastrapur |
| Ahmedabad, Guj 380015 | |
| E-mail address: | chaitalimohile@yahoo.co.in |
Traders' Resource Links | |
| Independent has not added any product or service information to TRADERS' RESOURCE. | |
Click here for more information about our publications!
PRINT THIS ARTICLE

Request Information From Our Sponsors
- StockCharts.com, Inc.
- Candle Patterns
- Candlestick Charting Explained
- Intermarket Technical Analysis
- John Murphy on Chart Analysis
- John Murphy's Chart Pattern Recognition
- John Murphy's Market Message
- MurphyExplainsMarketAnalysis-Intermarket Analysis
- MurphyExplainsMarketAnalysis-Visual Analysis
- StockCharts.com
- Technical Analysis of the Financial Markets
- The Visual Investor
- VectorVest, Inc.
- Executive Premier Workshop
- One-Day Options Course
- OptionsPro
- Retirement Income Workshop
- Sure-Fire Trading Systems (VectorVest, Inc.)
- Trading as a Business Workshop
- VectorVest 7 EOD
- VectorVest 7 RealTime/IntraDay
- VectorVest AutoTester
- VectorVest Educational Services
- VectorVest OnLine
- VectorVest Options Analyzer
- VectorVest ProGraphics v6.0
- VectorVest ProTrader 7
- VectorVest RealTime Derby Tool
- VectorVest Simulator
- VectorVest Variator
- VectorVest Watchdog