HOT TOPICS LIST
- MACD
- Fibonacci
- RSI
- Gann
- ADXR
- Stochastics
- Volume
- Triangles
- Futures
- Cycles
- Volatility
- ZIGZAG
- MESA
- Retracement
- Aroon
INDICATORS LIST
LIST OF TOPICS
PRINT THIS ARTICLE
by Koos van der Merwe
Yes, there are so many indicators out there today to analyze a stock technically, that finding the best one is like pulling teeth.
Position: Sell
Koos van der Merwe
Has been a technical analyst since 1969, and has worked as a futures and options trader with First Financial Futures in Johannesburg, South Africa.
PRINT THIS ARTICLE
STOCHASTICS
A Look At The Stochastic Oscillator
02/25/16 11:04:50 AMby Koos van der Merwe
Yes, there are so many indicators out there today to analyze a stock technically, that finding the best one is like pulling teeth.
Position: Sell
| In the 1950's, Dr. George Lane developed the stochastic oscillator. The oscillator is a technical momentum indicator that compares a security's closing price to its price range over a given time period. The oscillator is extremely sensitive to market movements. This sensitivity can be adjusted by reducing or increasing the time period or by taking a moving average of the result. The theory behind the indicator is that in an upward-trending market, prices tend to close near their high and during a downward-trending market prices tend to close near their low. In all my years of trading, and looking at many indicators, I have found that the indicator, combined with the RSI indicator has been very successful in forecasting the movement of a stock. Personally, I use a 14-period with a 3-period moving average. Below are charts that show how the indicator functions. |

|
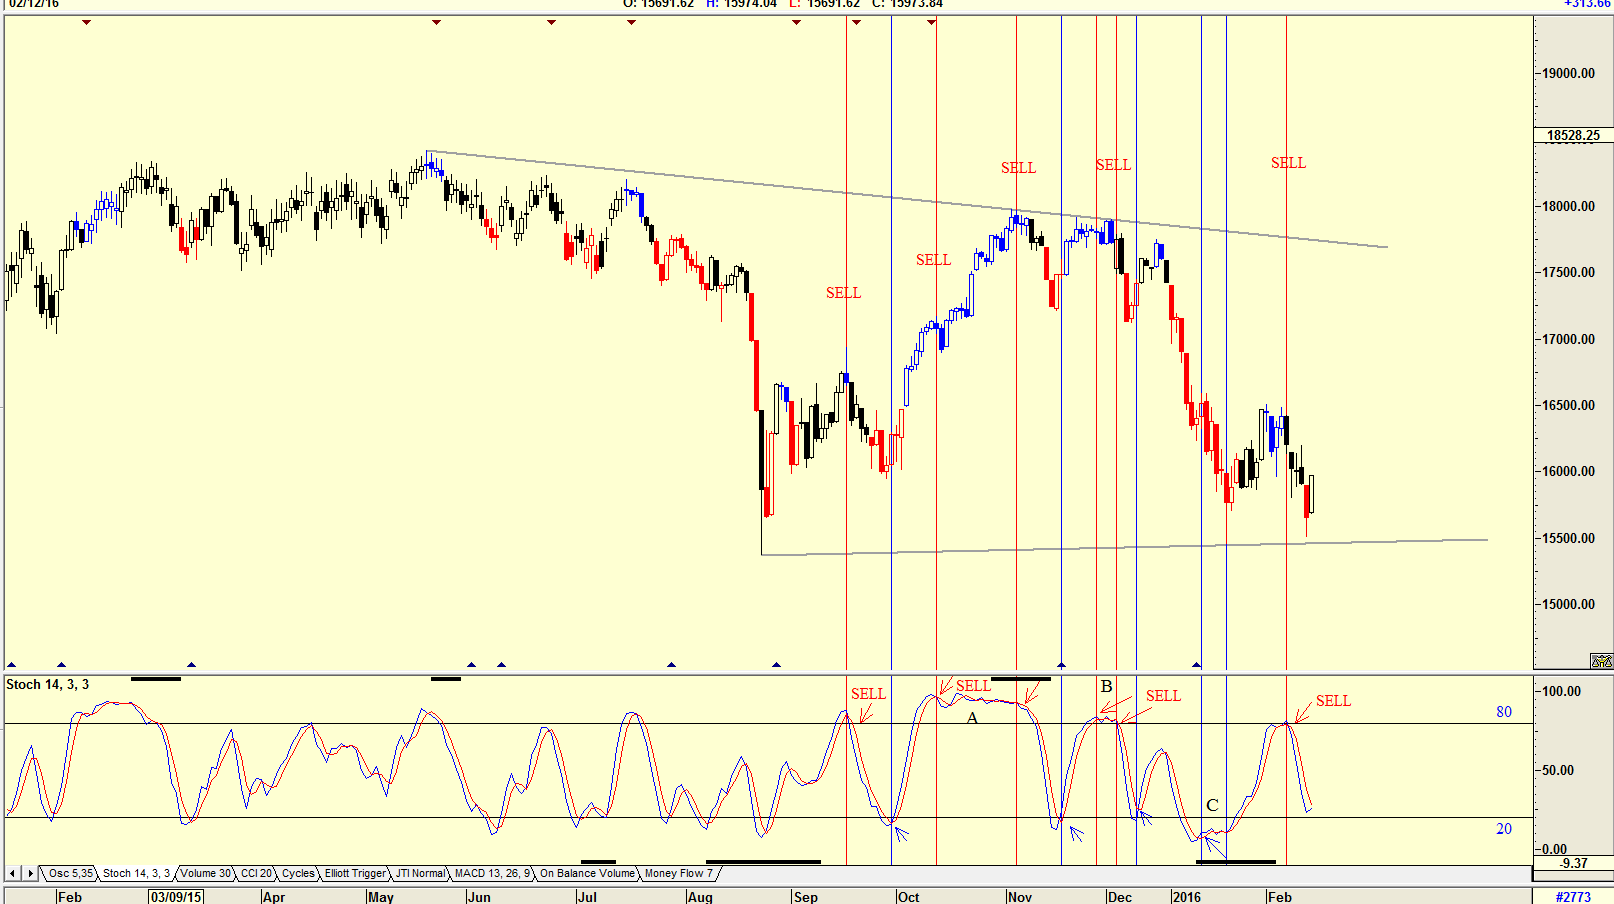
| Figure 1. Dow Jones with the Stochastic Indicator. |
| Graphic provided by: AdvancedGET. |
| |
| The chart in Figure 1 is a daily chart of the Dow Jones with a stochastic indicator showing buy and sell signals as the 14-period stochastic crossed the 3-period moving average. Buy signals are given when this occurs below the 20-period horizontal line and sell signals when it is given above the 80-horizontal line. On some occasions the indicator is inclined to give a signal as the Index is still rising, or falling, as shown on the chart markers A, B and C. With a sell signal, it is acceptable to sell in a rising market, however with a buy signal one should not buy in a falling market, as suggested by C. The buy and sell signals on the chart are triggered when the indicator crosses the moving average. George Lane originally designed the indicator so that a buy signal would be triggered when the indicator broke above the 20 horizontal line and a sell signal when it broke below the 80 horizontal line. |

|
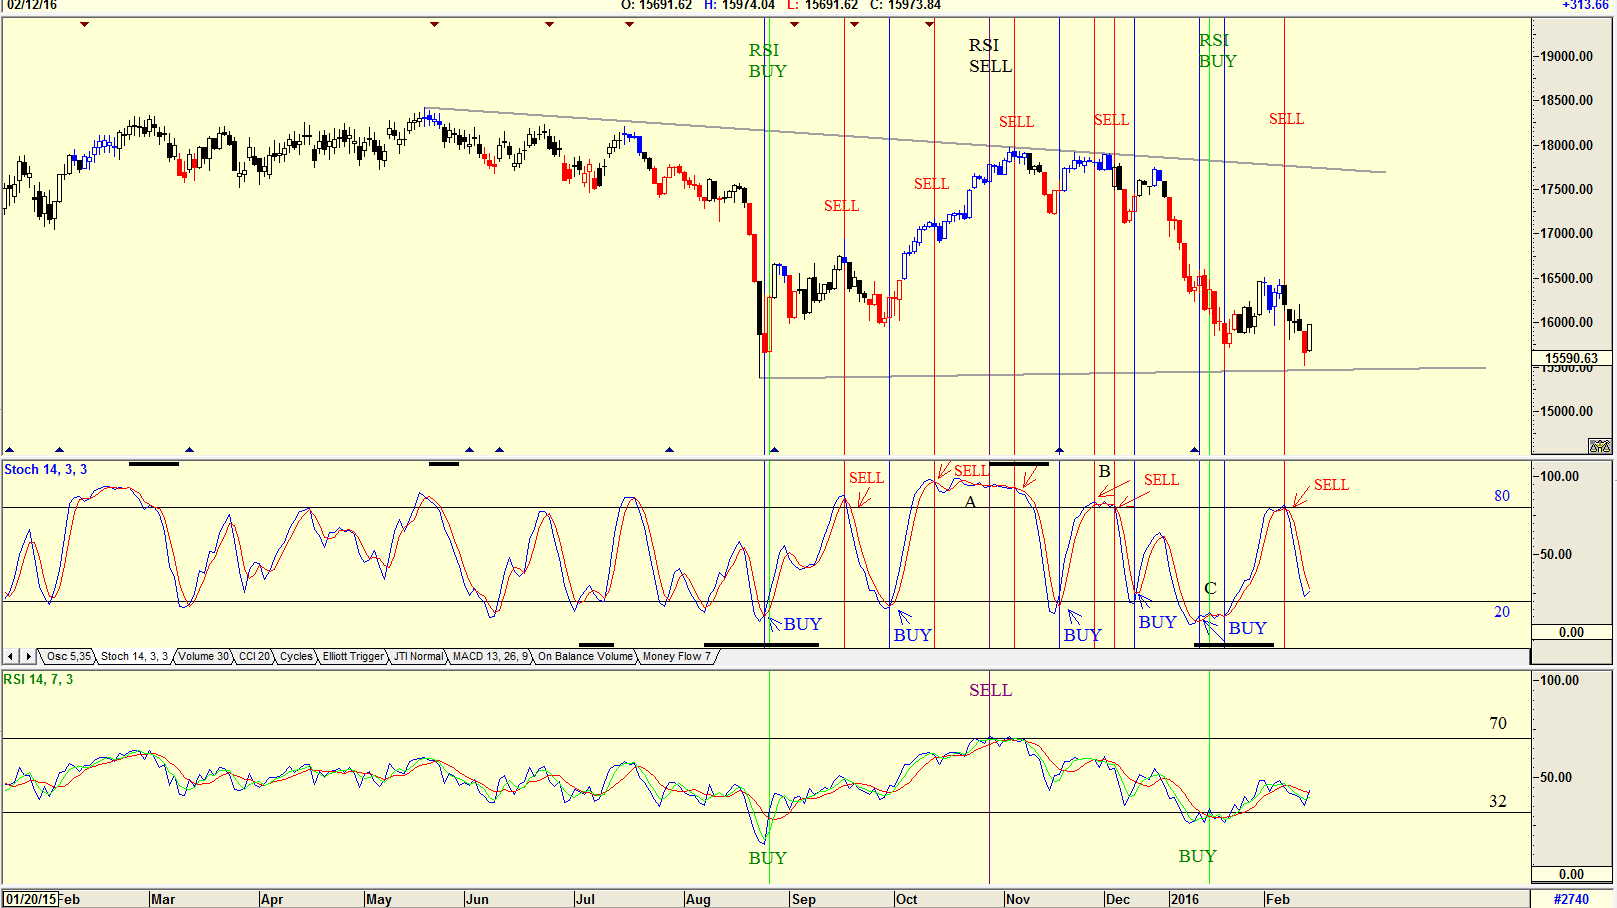
| Figure 2. Dow Jones with Stochastic and RSI indicators. |
| Graphic provided by: AdvancedGET. |
| |
| The chart in Figure 2 is a chart of the Dow with the Stochastic Indicators of Figure 1 and the RSI 14-period indicator. Note how in two instances the RSI buy was close to the Stochastic buy, but the RSI sell signal was much later then the first sell signal of the stochastic, but close enough to a second stochastic sell signal to be acceptable. This does suggest that the stochastic would be more of an indicator to a day trader, with the RSI indicator more acceptable to a longer term trader. |

|
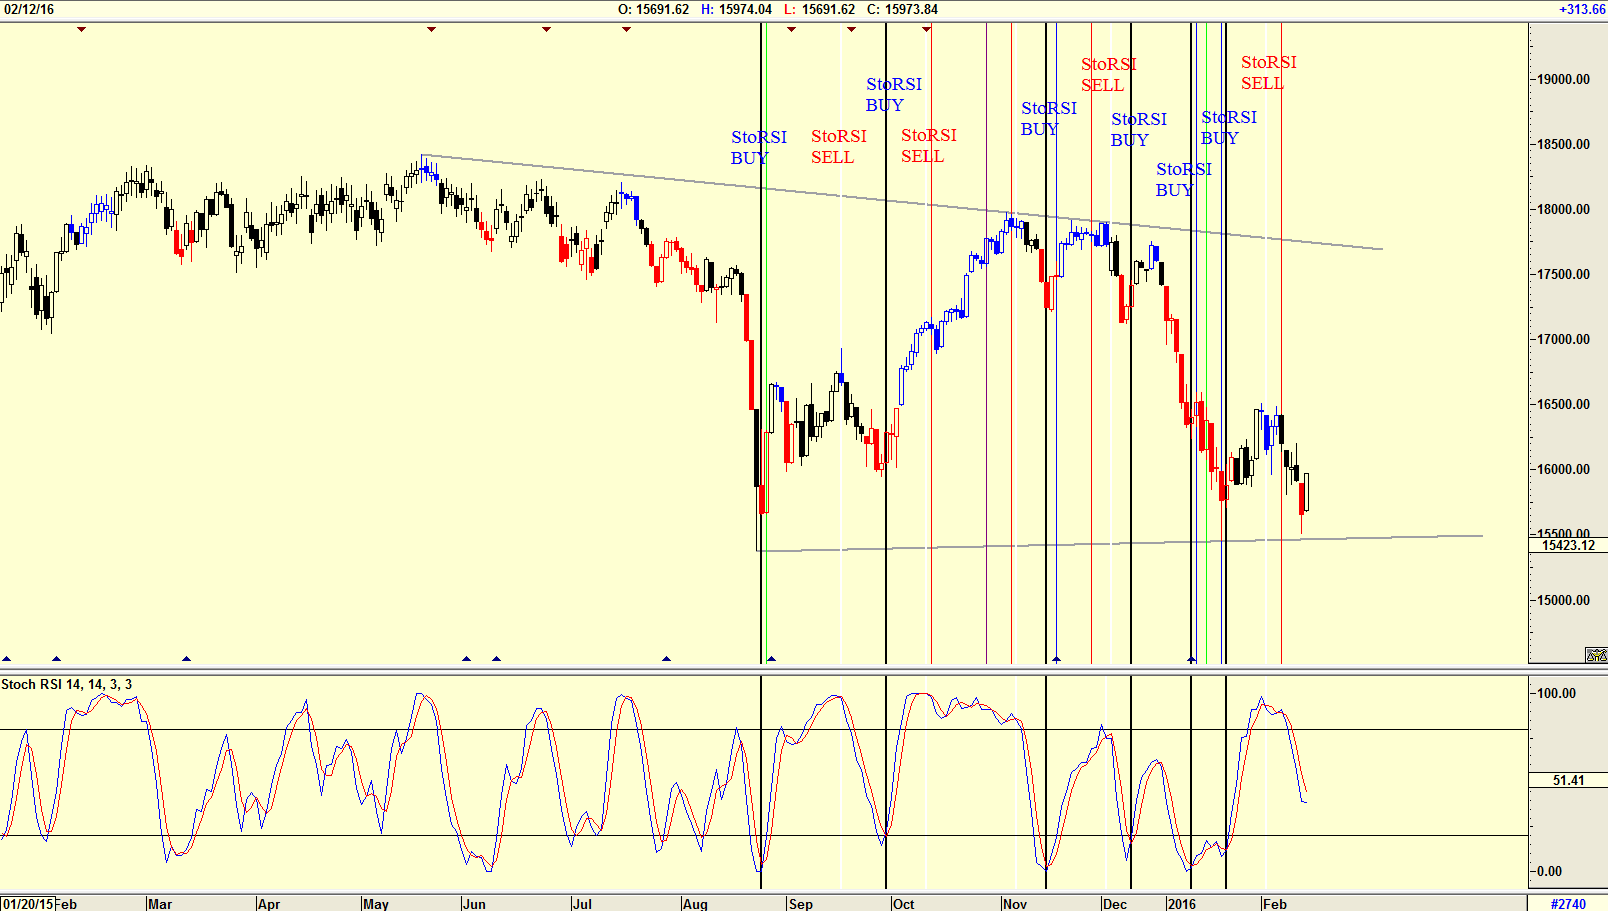
| Figure 3. Dow Jones with Stochastic RSI Indicator. |
| Graphic provided by: AdvancedGET. |
| |
| Then of course, combining to two indicators into one was a natural. The chart in Figure 3 is a chart of the Dow Jones daily with the Stochastic RSI indicator. Do note how the indicator is far more accurate than either the Stochastic Indicator or the RSI indicator. The buy and sell signals are triggered when the indicator crosses below the moving average but the signals can only be given if, for a buy, the indicator is below the 20 horizontal line and for a sell, above the 80 horizontal line. So, to conclude, whichever of the three indicators one uses, it is obvious that the Stochastic RSI indicator is the best choice. One thing however does become clear, and that is that all three charts are suggesting that the Dow Jones has further to fall. |
Has been a technical analyst since 1969, and has worked as a futures and options trader with First Financial Futures in Johannesburg, South Africa.
| Address: | 3256 West 24th Ave |
| Vancouver, BC | |
| Phone # for sales: | 6042634214 |
| E-mail address: | petroosp@gmail.com |
Click here for more information about our publications!
Comments
Date: 03/02/16Rank: 4Comment: Vow.
Date: 06/27/21Rank: 5Comment:

Request Information From Our Sponsors
- StockCharts.com, Inc.
- Candle Patterns
- Candlestick Charting Explained
- Intermarket Technical Analysis
- John Murphy on Chart Analysis
- John Murphy's Chart Pattern Recognition
- John Murphy's Market Message
- MurphyExplainsMarketAnalysis-Intermarket Analysis
- MurphyExplainsMarketAnalysis-Visual Analysis
- StockCharts.com
- Technical Analysis of the Financial Markets
- The Visual Investor
- VectorVest, Inc.
- Executive Premier Workshop
- One-Day Options Course
- OptionsPro
- Retirement Income Workshop
- Sure-Fire Trading Systems (VectorVest, Inc.)
- Trading as a Business Workshop
- VectorVest 7 EOD
- VectorVest 7 RealTime/IntraDay
- VectorVest AutoTester
- VectorVest Educational Services
- VectorVest OnLine
- VectorVest Options Analyzer
- VectorVest ProGraphics v6.0
- VectorVest ProTrader 7
- VectorVest RealTime Derby Tool
- VectorVest Simulator
- VectorVest Variator
- VectorVest Watchdog
