HOT TOPICS LIST
- MACD
- Fibonacci
- RSI
- Gann
- ADXR
- Stochastics
- Volume
- Triangles
- Futures
- Cycles
- Volatility
- ZIGZAG
- MESA
- Retracement
- Aroon
INDICATORS LIST
LIST OF TOPICS
PRINT THIS ARTICLE
by Koos van der Merwe
When a reputable company's share price collapses, do you buy the share?
Position: Hold
Koos van der Merwe
Has been a technical analyst since 1969, and has worked as a futures and options trader with First Financial Futures in Johannesburg, South Africa.
PRINT THIS ARTICLE
HEAD & SHOULDERS
A Look At LinkedIn
02/17/16 04:58:26 PMby Koos van der Merwe
When a reputable company's share price collapses, do you buy the share?
Position: Hold
| LinkedIn, founded in 2002, is a business orientated social networking service. The service was launched on May 5th, 2003 and is used mainly for professional networking. On Friday, February 5th, investors gave LinkedIn a poor job review by selling off the share dramatically, wiping off nearly $11 billion in its market value. Its forecast for slower growth in 2016 was the reason for the 44% plunge. After the market closed Thursday, the online company reported better-than-expected earnings for the last quarter but warned that revenue would fall short of what analysts had projected for 2016. It also said it was discontinuing a new online advertising system that hadn't worked out. LinkedIn has a track record of issuing conservative forecasts, and then beating them, however this time it appears that investors were shaken by the company's financial guidance. On Friday, February 5th, the share price dropped 40%, from $191.48 to close at $108.38. The question on everyone's lips now is, what for the future? |

|
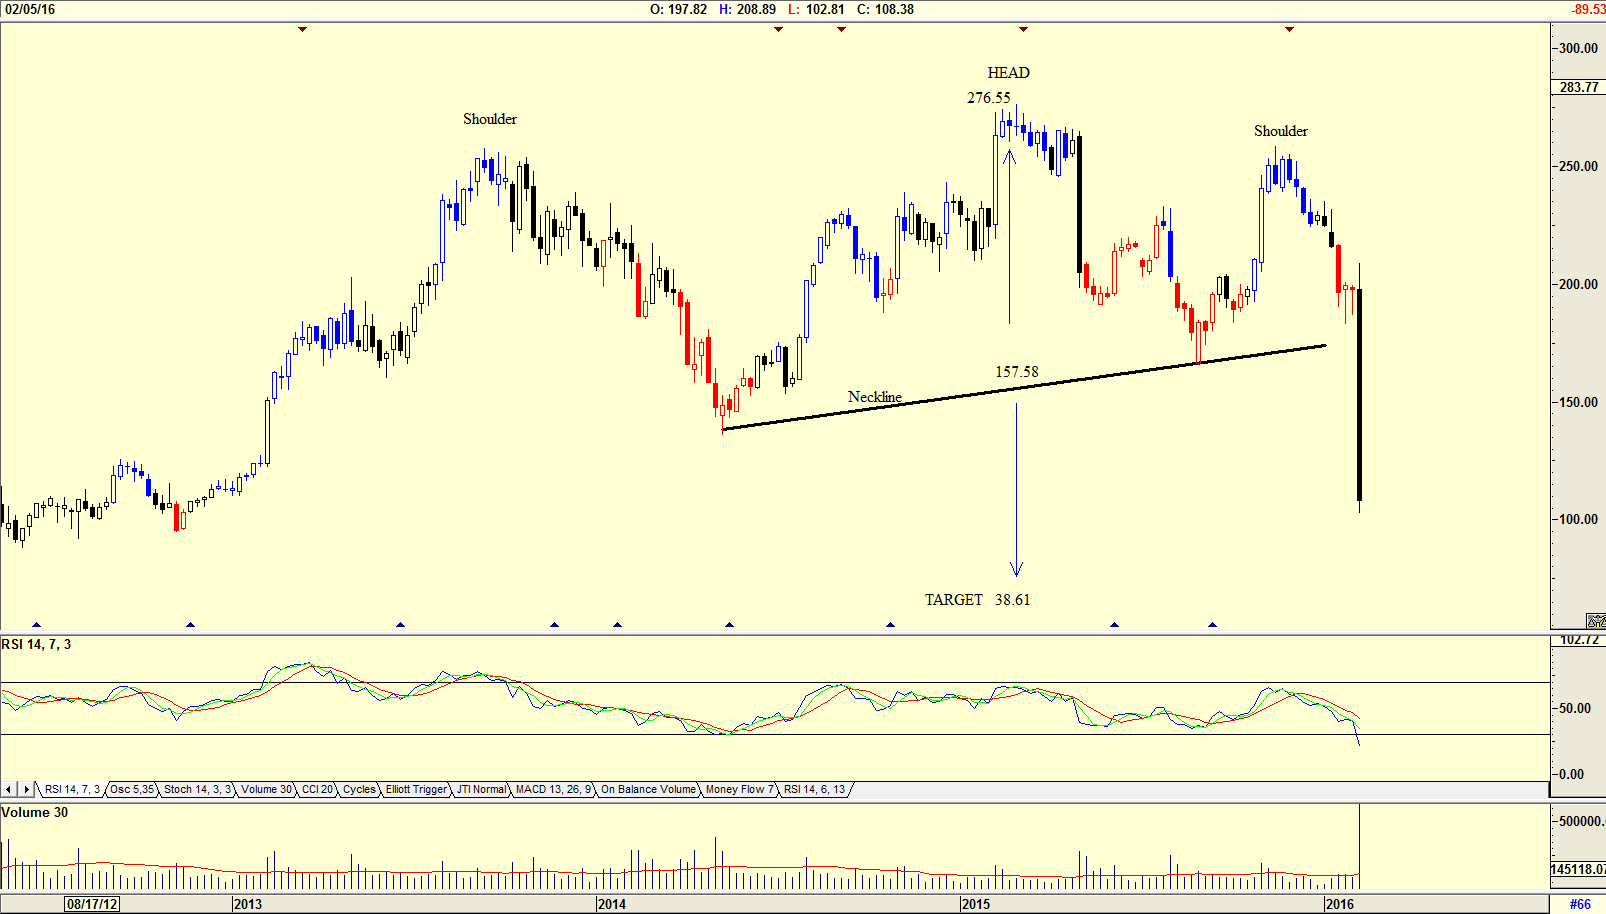
| Figure 1. Weekly chart for LinkedIn showing a head and shoulders pattern. |
| Graphic provided by: AdvancedGET. |
| |
| The chart in Figure 1 is a weekly chart showing a head and shoulders pattern. The pattern is suggesting that the share price could fall to $38.61. (276.55-157.58 = 118.97. 157.58-118.97=38.61). Volume shown was extremely high with the price collapse, suggesting further weakness, as does the RSI indicator which, although at oversold levels, has not yet turned up to retest the 32 horizontal. |

|
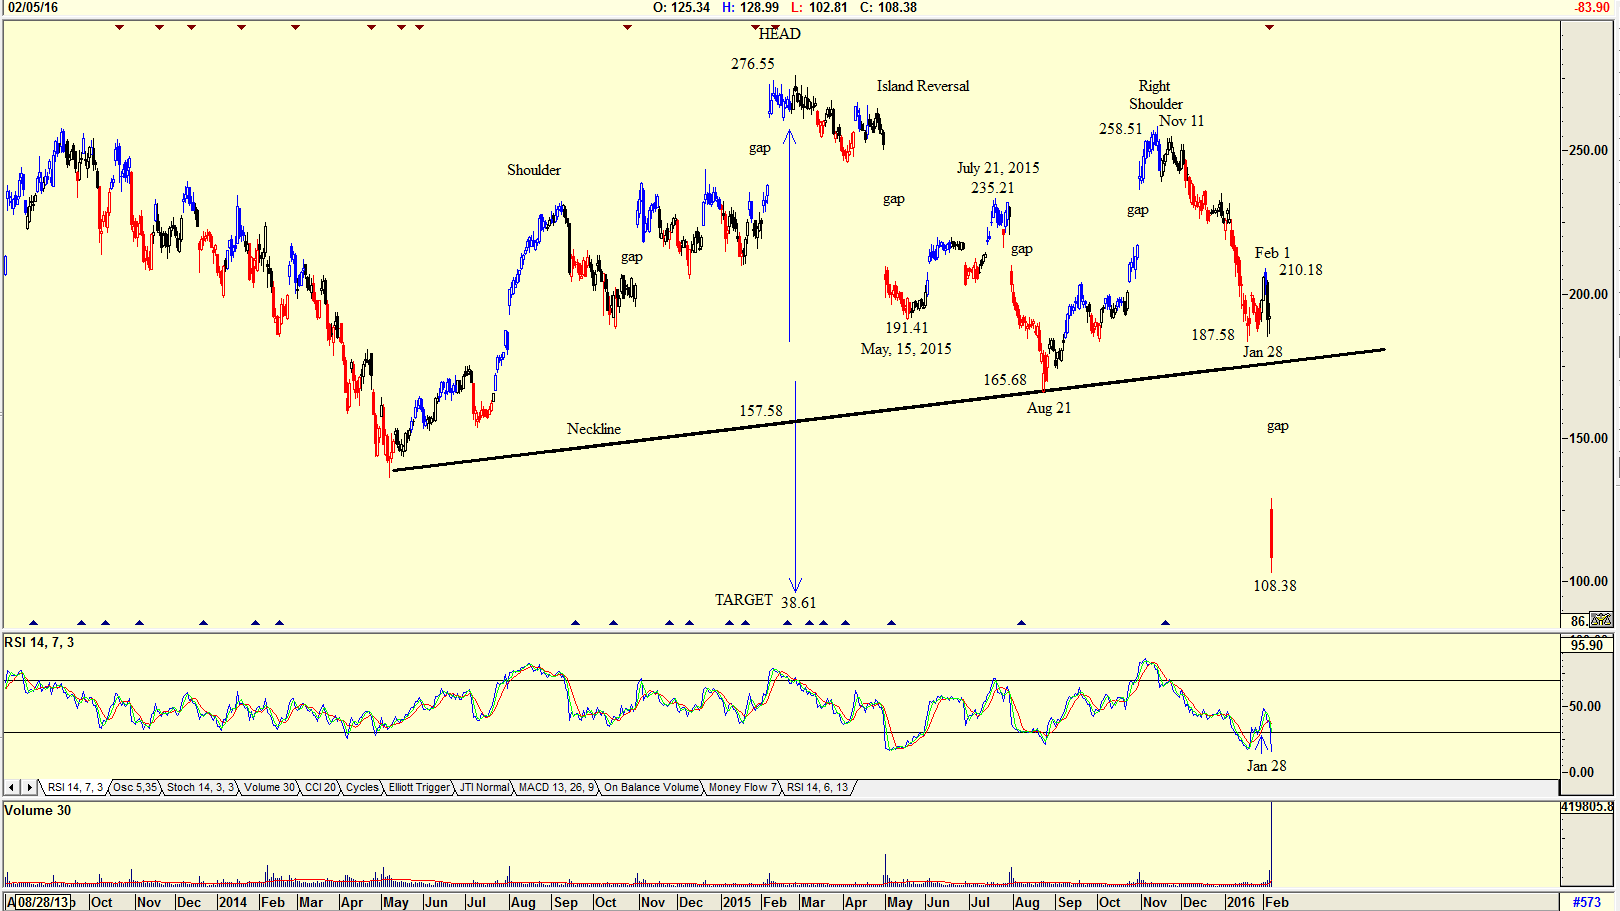
| Figure 2. Daily chart for LinkedIn showing the gaps that have formed. |
| Graphic provided by: AdvancedGET. |
| |
| The daily chart in Figure 2 shows the head and shoulders pattern of Figure 1 but also suggests a possible island reversal at the head. An island reversal is where the share price rises on a gap, and then after trading for a short time at the high price, falls on a gap. The chart shows how the share price fell to $191.41 by May 15th 2015, then rose to $235.21 by July 21st, and fell once again on a gap to form the head and shoulders neckline at $165.68 on August 21st. The share price then rose to form the right shoulder at $258.51 on November 11th, and then fell strongly and on a gap to its present price of $108.38. Do note that on January 28th, the RSI signaled a buy when the price was $187.58, and the price did rise to $210.18 by February 1st but then fell ahead of results. Yes, the theory is that a price does rise to fill a gap, which means that we could expect the share price to bottom at around the present price. With the RSI at oversold levels once again, one should however wait for a buy signal to be given. How high could the share price rise? That is anyone's guess. One should wait for a solid bottom to form before considering buying the share. Remember, that gap must be filled. |
Has been a technical analyst since 1969, and has worked as a futures and options trader with First Financial Futures in Johannesburg, South Africa.
| Address: | 3256 West 24th Ave |
| Vancouver, BC | |
| Phone # for sales: | 6042634214 |
| E-mail address: | petroosp@gmail.com |
Click here for more information about our publications!
PRINT THIS ARTICLE

Request Information From Our Sponsors
- StockCharts.com, Inc.
- Candle Patterns
- Candlestick Charting Explained
- Intermarket Technical Analysis
- John Murphy on Chart Analysis
- John Murphy's Chart Pattern Recognition
- John Murphy's Market Message
- MurphyExplainsMarketAnalysis-Intermarket Analysis
- MurphyExplainsMarketAnalysis-Visual Analysis
- StockCharts.com
- Technical Analysis of the Financial Markets
- The Visual Investor
- VectorVest, Inc.
- Executive Premier Workshop
- One-Day Options Course
- OptionsPro
- Retirement Income Workshop
- Sure-Fire Trading Systems (VectorVest, Inc.)
- Trading as a Business Workshop
- VectorVest 7 EOD
- VectorVest 7 RealTime/IntraDay
- VectorVest AutoTester
- VectorVest Educational Services
- VectorVest OnLine
- VectorVest Options Analyzer
- VectorVest ProGraphics v6.0
- VectorVest ProTrader 7
- VectorVest RealTime Derby Tool
- VectorVest Simulator
- VectorVest Variator
- VectorVest Watchdog
