

HOT TOPICS LIST
- MACD
- Fibonacci
- RSI
- Gann
- ADXR
- Stochastics
- Volume
- Triangles
- Futures
- Cycles
- Volatility
- ZIGZAG
- MESA
- Retracement
- Aroon
INDICATORS LIST
LIST OF TOPICS
PRINT THIS ARTICLE
by Chaitali Mohile
DuPont is an example to highlight a few simple but reliable techniques that can save traders from huge uncertainty.
Position: N/A
Chaitali Mohile
Active trader in the Indian stock markets since 2003 and a full-time writer. Trading is largely based upon technical analysis.
PRINT THIS ARTICLE
TECHNICAL ANALYSIS
Simple Techniques In A Volatile Market
02/10/16 02:50:21 PMby Chaitali Mohile
DuPont is an example to highlight a few simple but reliable techniques that can save traders from huge uncertainty.
Position: N/A
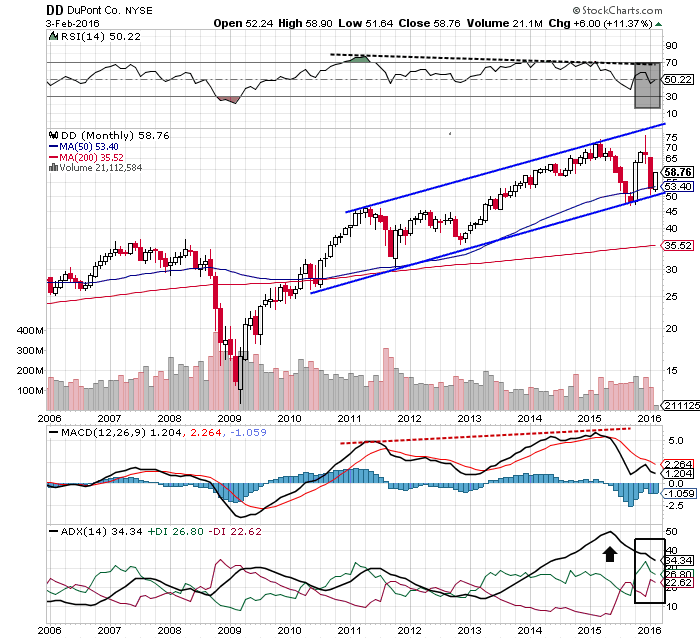
| It is very difficult to trade the stocks in the current financial market scenario. Choosing an appropriate stock is one big challenge in such conditions. Selecting correct trading techniques from the various options increases the difficulties of traders. Following simple and reliable trading techniques like trendlines and moving averages can protect traders from a huge loss. On the monthly chart of DuPont (DD) in Figure 1, an ascending channel is formed by the two trendlines. The upper trendline connects higher highs whereas the lower one is formed by joining higher lows. These trendlines formed a strong support-resistance region for DD. |
| The trendline is a very useful and reliable technique, particularly in the volatile markets. Traders can keep definite stop-loss orders near these trendlines to protect their profit. They also need to follow and respect these stop-losses strictly. Disciplined trading reduces the risk. In Figure 1, the lower trendline and the 50-day moving average (MA) are moving together, thus establishing strong support for the future rally. The stock is about to initiate a fresh upwards rally from the support. The stop-loss for this trade would be marginally below the trendline support that is near $45. Thus, the long position will be protected in the negative market as well. |
|
| Figure 1. Monthly Chart Of DuPont Co (DD). The upper and lower trendlines shows the trading range of the stock. The trendlines, along with the moving averages, form strong support-resistance for DD. |
| Graphic provided by: StockCharts.com. |
| |
| Traders can buy this stock as the technical indicators in Figure 1 are showing bullish indications. The relative strength index (RSI)(14) is resting near the center line (50 levels), the moving average convergence/divergence (MACD)(12,26,9) is declining in positive territory, and an overheated uptrend indicated by the average directional index (ADX)(14) has shifted in a developed trend area. These indicators have descended from their extreme bullish region to a stable area, thus allotting a space for the future rally. |
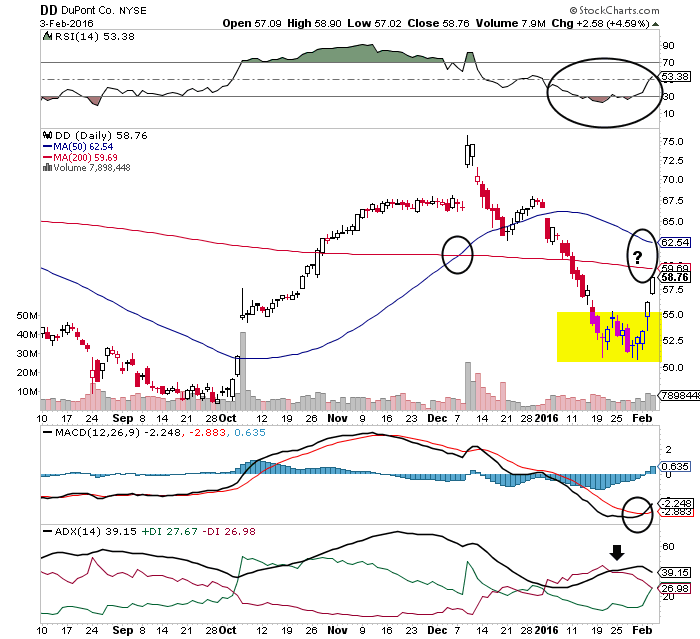
| On the daily chart in Figure 2, DD has already begun a pullback rally from the bearish region. The stock has plunged below the long-term (200-day) moving average (MA) support. The stock is considered to be bearish if it breaches this robust support. DD formed a bottom and is ready to surge towards the MA resistance. After the bullish moving average crossover (see the black circle) in December 2015, the 50-day Ma has stabilized above long-term Ma. This highlights the bullish sentiments. |
|
| Figure 2. Daily Chart Of DuPont Co (DD). The stock has its upwards journey with the initial target of the 200-day MA resistance. |
| Graphic provided by: StockCharts.com. |
| |
| The RSI(14) has recovered from the oversold levels, and the MACD(12,26,9) has underwent a bullish crossover in negative territory. In addition, an intermediate downtrend is weakening as the selling pressure (red line) seen in ADX(14) is declining. Therefore, DD is likely to convert the 200-day MA resistance to support. Later, the stock is likely to move within the narrow range of Ma support-resistance. To conclude, these simple observations and indications can protect the trade in any uncertainty. To get confirmed signals, the trendlines and the support-resistance of the moving average are to be followed along with the technical indicators. |
Active trader in the Indian stock markets since 2003 and a full-time writer. Trading is largely based upon technical analysis.
| Company: | Independent |
| Address: | C1/3 Parth Indraprasth Towers. Vastrapur |
| Ahmedabad, Guj 380015 | |
| E-mail address: | chaitalimohile@yahoo.co.in |
Traders' Resource Links | |
| Independent has not added any product or service information to TRADERS' RESOURCE. | |
Click here for more information about our publications!
Comments
Date:�02/10/16Rank:�5Comment:�
Date:�02/11/16Rank:�5Comment:�

Request Information From Our Sponsors
- StockCharts.com, Inc.
- Candle Patterns
- Candlestick Charting Explained
- Intermarket Technical Analysis
- John Murphy on Chart Analysis
- John Murphy's Chart Pattern Recognition
- John Murphy's Market Message
- MurphyExplainsMarketAnalysis-Intermarket Analysis
- MurphyExplainsMarketAnalysis-Visual Analysis
- StockCharts.com
- Technical Analysis of the Financial Markets
- The Visual Investor
- VectorVest, Inc.
- Executive Premier Workshop
- One-Day Options Course
- OptionsPro
- Retirement Income Workshop
- Sure-Fire Trading Systems (VectorVest, Inc.)
- Trading as a Business Workshop
- VectorVest 7 EOD
- VectorVest 7 RealTime/IntraDay
- VectorVest AutoTester
- VectorVest Educational Services
- VectorVest OnLine
- VectorVest Options Analyzer
- VectorVest ProGraphics v6.0
- VectorVest ProTrader 7
- VectorVest RealTime Derby Tool
- VectorVest Simulator
- VectorVest Variator
- VectorVest Watchdog