HOT TOPICS LIST
- MACD
- Fibonacci
- RSI
- Gann
- ADXR
- Stochastics
- Volume
- Triangles
- Futures
- Cycles
- Volatility
- ZIGZAG
- MESA
- Retracement
- Aroon
INDICATORS LIST
LIST OF TOPICS
PRINT THIS ARTICLE
by Gary Grosschadl
Gold's choppy action may continue until we get a decisive move via a triangle break or a reversal off trendline.
Position: N/A
Gary Grosschadl
Independent Canadian equities trader and technical analyst based in Peterborough
Ontario, Canada.
PRINT THIS ARTICLE
CHART ANALYSIS
Gold Index Looks Rangebound, Waiting For Triangle Break
11/21/02 09:53:16 AMby Gary Grosschadl
Gold's choppy action may continue until we get a decisive move via a triangle break or a reversal off trendline.
Position: N/A
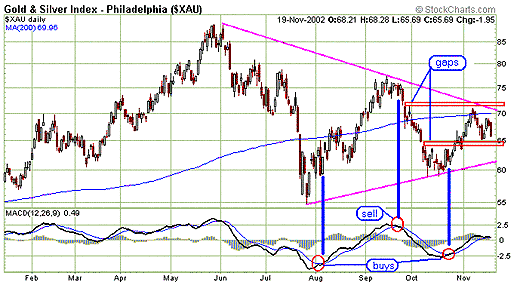
| Many traders recognize the symmetrical triangles present for various golds and their indices. The XAU gold index chart also shows this well. It seems lately that previous gaps are coming into play as this rangebound action continues, as shown in the chart below. Eventually a bigger move will ensue as the triangle plays out. Since this triangle should be viewed as neutral, a downside break is as likely as an upside one. |
| If today's bearish action continues and overcomes that gap support, a lower trendline challenge is likely. If it breaks down with conviction, traders may choose to short golds. If on the other hand it bounces off the trendline, long positions in gold stocks or derivatives should be profitable as a move towards opposite trendline is likely. |

|
| Graphic provided by: stockcharts.com. |
| |
| The MACD (moving average convergence/divergence) indicator is displayed to show how this can be an aid in determining tradeable turning points. The chart shows how a trendline touch and subsequent reversal was well timed using the crossover signal of the two MAs incorporated in the MACD indicator. These crossover signals acted as confirmations that a sizable reversal move was happenning. |
| Currently the MACD is not giving a clear trading signal as it can stall at this zero line or turn either way. A better trading signal is more likely to occur at the next trendline touch. The MACD may give valuable clues to the alert trader at a later date but until then it's prudent to consider this gold index (and the many gold stocks that mimic it) as rangebound for now. |
Independent Canadian equities trader and technical analyst based in Peterborough
Ontario, Canada.
| Website: | www.whatsonsale.ca/financial.html |
| E-mail address: | gwg7@sympatico.ca |
Click here for more information about our publications!
Comments
Date: 11/25/02Rank: 4Comment:

Request Information From Our Sponsors
- StockCharts.com, Inc.
- Candle Patterns
- Candlestick Charting Explained
- Intermarket Technical Analysis
- John Murphy on Chart Analysis
- John Murphy's Chart Pattern Recognition
- John Murphy's Market Message
- MurphyExplainsMarketAnalysis-Intermarket Analysis
- MurphyExplainsMarketAnalysis-Visual Analysis
- StockCharts.com
- Technical Analysis of the Financial Markets
- The Visual Investor
- VectorVest, Inc.
- Executive Premier Workshop
- One-Day Options Course
- OptionsPro
- Retirement Income Workshop
- Sure-Fire Trading Systems (VectorVest, Inc.)
- Trading as a Business Workshop
- VectorVest 7 EOD
- VectorVest 7 RealTime/IntraDay
- VectorVest AutoTester
- VectorVest Educational Services
- VectorVest OnLine
- VectorVest Options Analyzer
- VectorVest ProGraphics v6.0
- VectorVest ProTrader 7
- VectorVest RealTime Derby Tool
- VectorVest Simulator
- VectorVest Variator
- VectorVest Watchdog
