HOT TOPICS LIST
- MACD
- Fibonacci
- RSI
- Gann
- ADXR
- Stochastics
- Volume
- Triangles
- Futures
- Cycles
- Volatility
- ZIGZAG
- MESA
- Retracement
- Aroon
INDICATORS LIST
LIST OF TOPICS
PRINT THIS ARTICLE
by Koos van der Merwe
Yes, the Dow does appear to have bottomed, but the question is, do you buy or sell?
Position: Buy
Koos van der Merwe
Has been a technical analyst since 1969, and has worked as a futures and options trader with First Financial Futures in Johannesburg, South Africa.
PRINT THIS ARTICLE
TECHNICAL ANALYSIS
Do You Buy Or Sell?
01/29/16 04:25:58 PMby Koos van der Merwe
Yes, the Dow does appear to have bottomed, but the question is, do you buy or sell?
Position: Buy
| My charts are suggesting that the Dow Jones, the S&P500 Index and the Nasdaq Index have all bottomed and could start rising strongly over the next few months. The question on everyone's lips however is, "Is the rise due to short covering, or is this an opportunity to buy shares that will rise strongly?" Then again, do you sell all the shares in your portfolio, into this strength in preparation for a major market correction? A tough question to answer, but it very much depends on whether you are a trader or an investor. A trader would buy at present levels, looking for a short term profit. An investor would watch the share rise closely, and sell their portfolio as the prices reach a top. Below are a few shares a trader could look at. The shares listed below are all based on the high Omnitrader Advisor rating. They are worth researching in greater depth. |

|
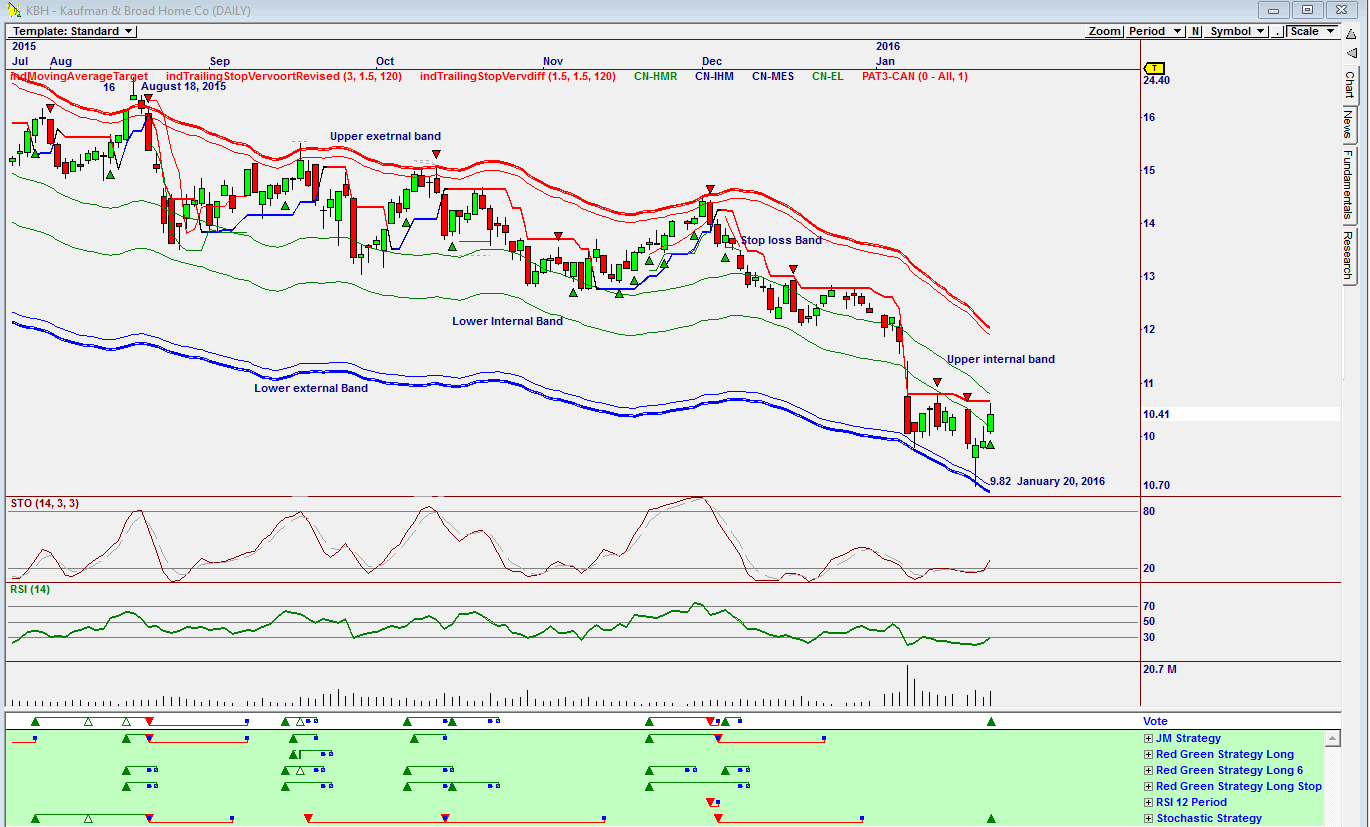
| Figure 1. Daily chart of KBH showing a Vote line buy. |
| Graphic provided by: Omnitrader. |
| |
| The chart in Figure 1 is a chart of Kaufman and Broad Home Co with an Advsior rating (not shown) of 94. The chart in Figure 1 shows how the share price has fallen from a high of $16.00 on August 18th, 2015 to a low of $9.82 by January 20th, 2016, finding support on the lower external band. Looking at the chart, one can see how the share price found support on the upper internal band as it dropped. This suggests that the lower internal band could act as a resistance level. Do note that both the Stochastic and RSI indicators are both suggesting a buy, but looking at the chart one can see that the buy signals suggested were short term only. Do note that the Vote line is suggesting a buy signal based on the Stochastic strategy. |

|
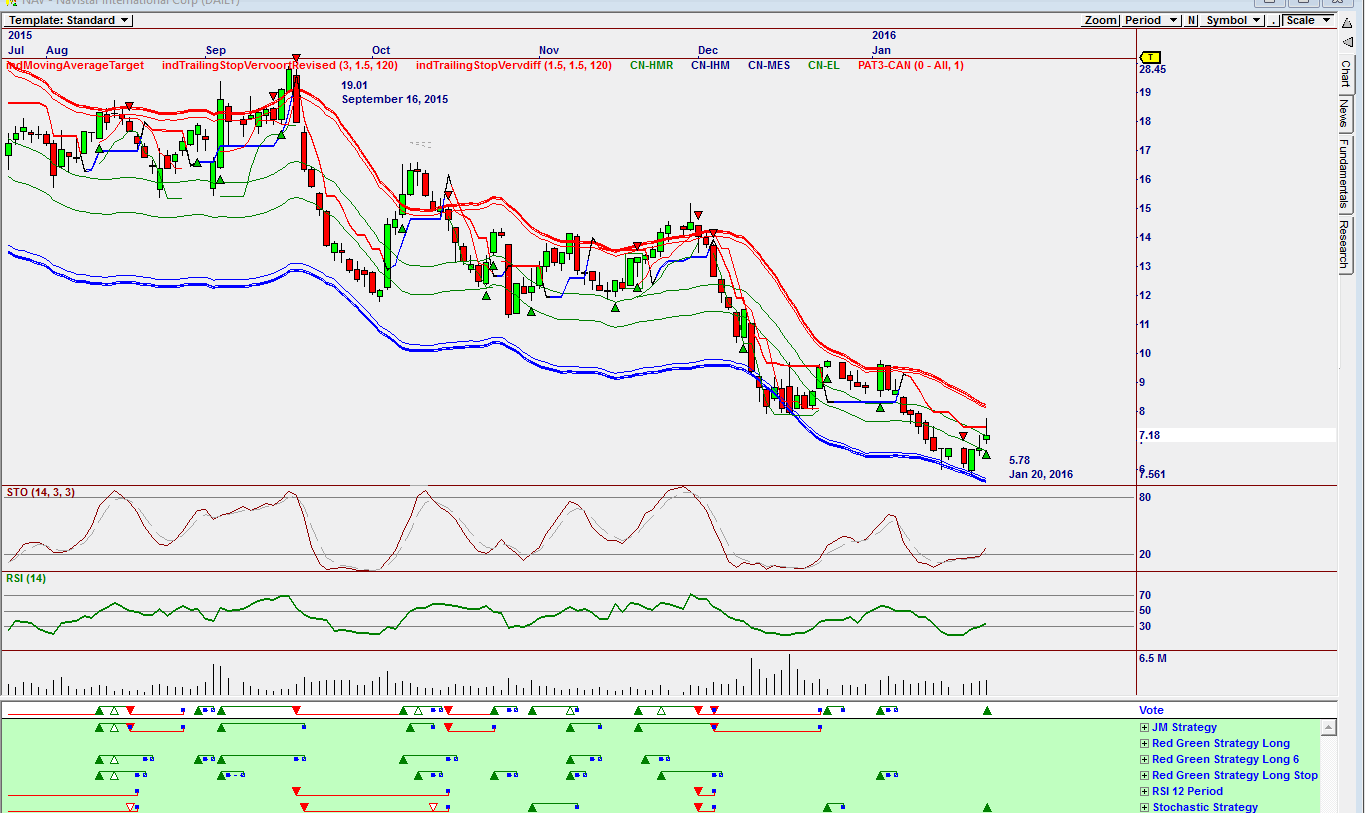
| Figure 2. Daily chart of NAV showing a Vote line buy. |
| Graphic provided by: Omnitrader. |
| |
| The chart in Figure 2 is a chart of Navistar International Corp. with an Advisor rating of 93. The chart shows how the share price has fallen from a high of $19.01 on September 16th, 2015 to a low of $5.78 by January 20th, 2016. Note how, in falling, the share price tended to bounce off the lower external band as support, and the upper external band as resistance. Once again, both indicators are suggesting a buy and once again the Vote line buy signal is suggested by the Stochastic strategy. |

|
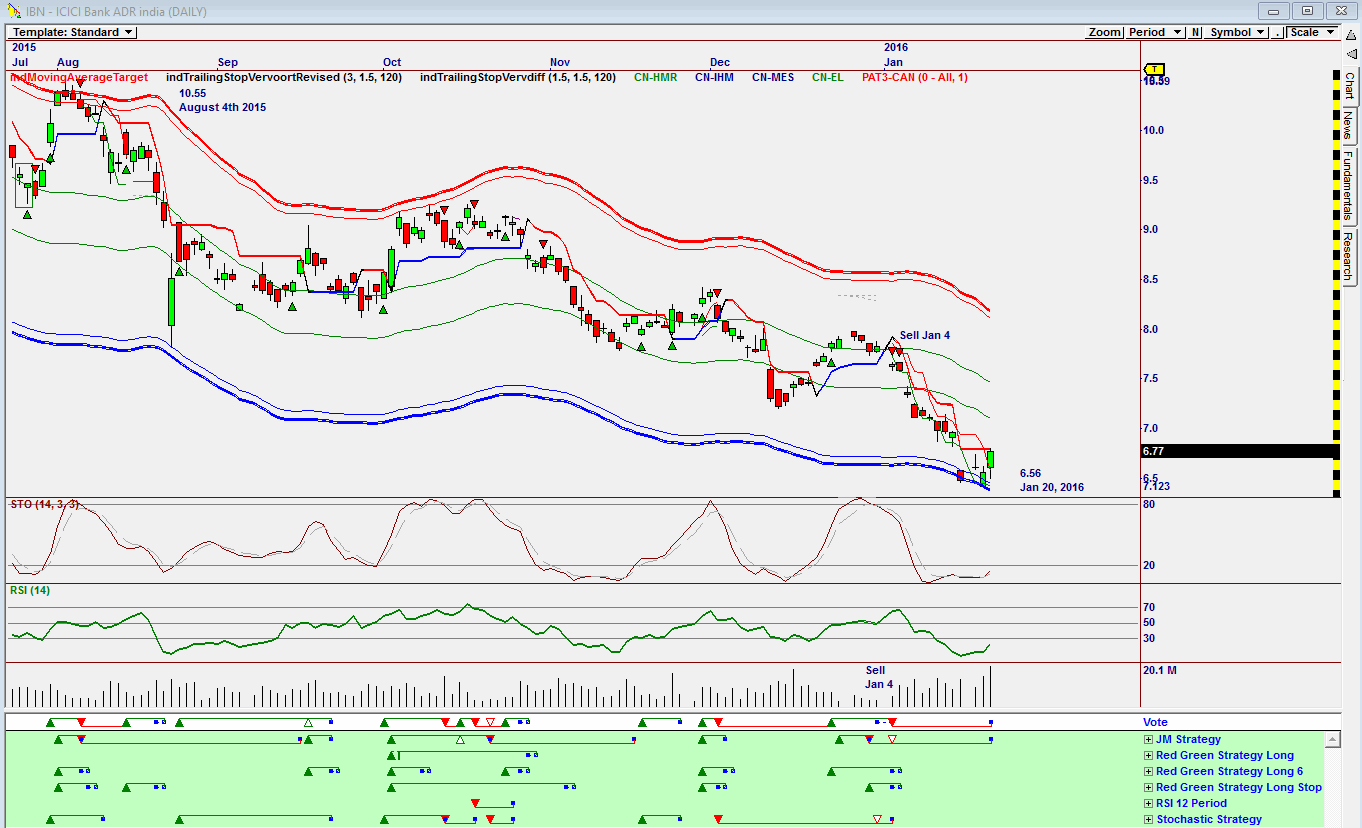
| Figure 3. Daily chart of IBN showing a stop on the sell signal. |
| Graphic provided by: Omnitrader. |
| |
| The chart in Figure 3 is a chart of ICI Bank ADR India. The share price on the chart fell from a high of $10.55 on August 4th, 2015 to a low of $6.56 by January 20th, 2016, finding support on the lower external band. Do note that the Vote line has NOT suggested a buy signal, but it is showing a stop on the sell signal given on January 4th, when the price found resistance on the upper internal band. One could wait for a Vote line buy signal, but the stop on the sell signal does bring the share to one's attention for further research. |

|
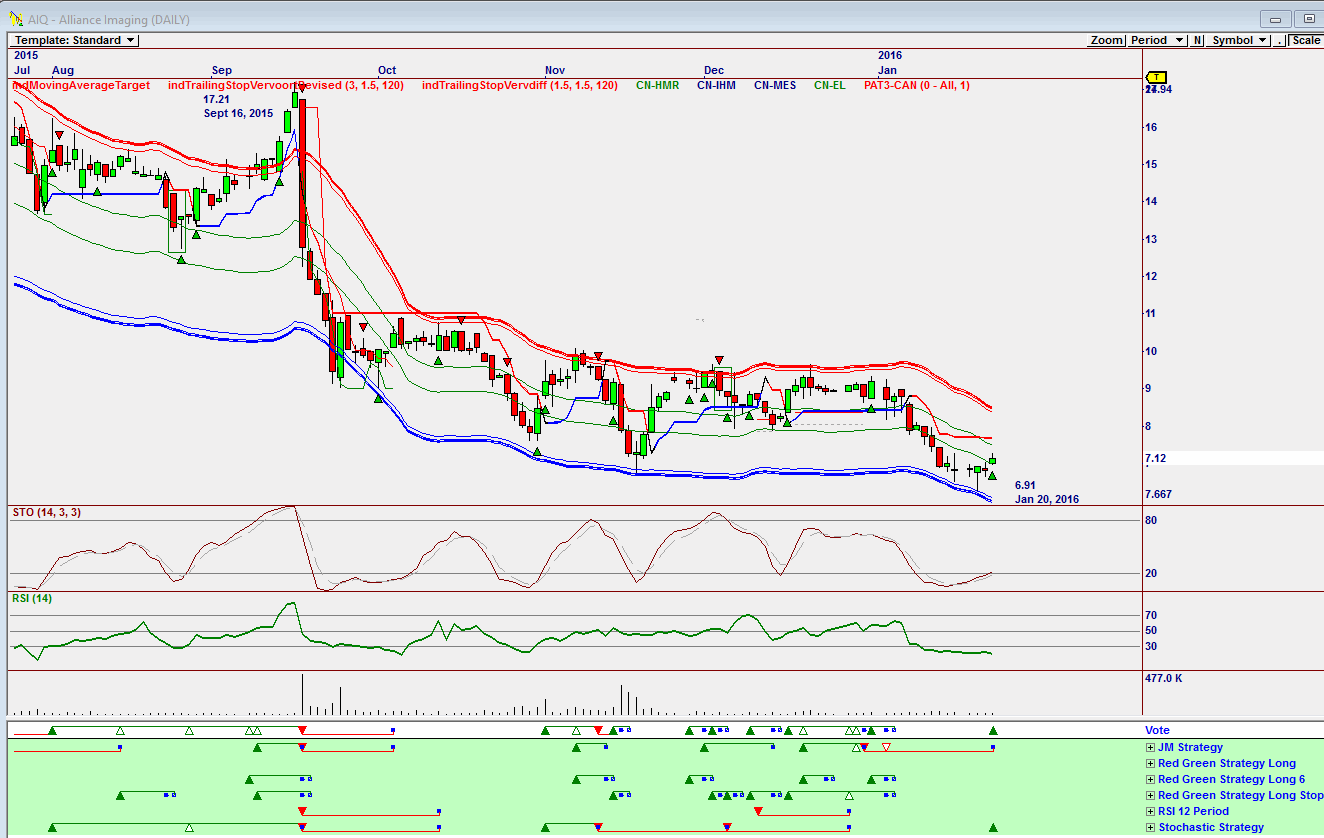
| Figure 4. Chart of AIQ showing a Vote line buy signal. |
| Graphic provided by: Omnitrader. |
| |
| The chart in Figure 4 is a chart of Alliance Imaging showing how the share price fell from a high of $17.21 on September 10th, 2015 to a low of $6.91 by January 20th, 2016. Both the Stochastic Indicator and the RSI indicator are at oversold levels, but have not suggested a buy. The Vote line however, has once again given a buy signal based on the Stochastic strategy with a stop on the JM Sell strategy. The Omnitrader program used to analyze the stock market and trading on Friday January, 22nd, has suggested many buy signals. I have chosen only four charts — those with the highest Advisor rating. I will investigate each share fundamentally using Elliott Wave theory on the Advanced GET program before I consider buying. For the short term, though, they do look interesting for a quick dollar. |
Has been a technical analyst since 1969, and has worked as a futures and options trader with First Financial Futures in Johannesburg, South Africa.
| Address: | 3256 West 24th Ave |
| Vancouver, BC | |
| Phone # for sales: | 6042634214 |
| E-mail address: | petroosp@gmail.com |
Click here for more information about our publications!
PRINT THIS ARTICLE

Request Information From Our Sponsors
- StockCharts.com, Inc.
- Candle Patterns
- Candlestick Charting Explained
- Intermarket Technical Analysis
- John Murphy on Chart Analysis
- John Murphy's Chart Pattern Recognition
- John Murphy's Market Message
- MurphyExplainsMarketAnalysis-Intermarket Analysis
- MurphyExplainsMarketAnalysis-Visual Analysis
- StockCharts.com
- Technical Analysis of the Financial Markets
- The Visual Investor
- VectorVest, Inc.
- Executive Premier Workshop
- One-Day Options Course
- OptionsPro
- Retirement Income Workshop
- Sure-Fire Trading Systems (VectorVest, Inc.)
- Trading as a Business Workshop
- VectorVest 7 EOD
- VectorVest 7 RealTime/IntraDay
- VectorVest AutoTester
- VectorVest Educational Services
- VectorVest OnLine
- VectorVest Options Analyzer
- VectorVest ProGraphics v6.0
- VectorVest ProTrader 7
- VectorVest RealTime Derby Tool
- VectorVest Simulator
- VectorVest Variator
- VectorVest Watchdog
