

HOT TOPICS LIST
- MACD
- Fibonacci
- RSI
- Gann
- ADXR
- Stochastics
- Volume
- Triangles
- Futures
- Cycles
- Volatility
- ZIGZAG
- MESA
- Retracement
- Aroon
INDICATORS LIST
LIST OF TOPICS
PRINT THIS ARTICLE
by Matt Blackman
In every major correction, rumors surface that a recession is in the wings. These same rumors have been circulating of late. If we are indeed in a true bear market and headed for recession, the yield curve will provide valuable warning.
Position: N/A
Matt Blackman
Matt Blackman is a full-time technical and financial writer and trader. He produces corporate and financial newsletters, and assists clients in getting published in the mainstream media. He is the host of TradeSystemGuru.com. Matt has earned the Chartered Market Technician (CMT) designation. Find out what stocks and futures Matt is watching on Twitter at www.twitter.com/RatioTrade
PRINT THIS ARTICLE
BOND & INTEREST RATE
The Yield Curve and What It Can Tell Us About Markets
02/04/16 04:09:13 PMby Matt Blackman
In every major correction, rumors surface that a recession is in the wings. These same rumors have been circulating of late. If we are indeed in a true bear market and headed for recession, the yield curve will provide valuable warning.
Position: N/A
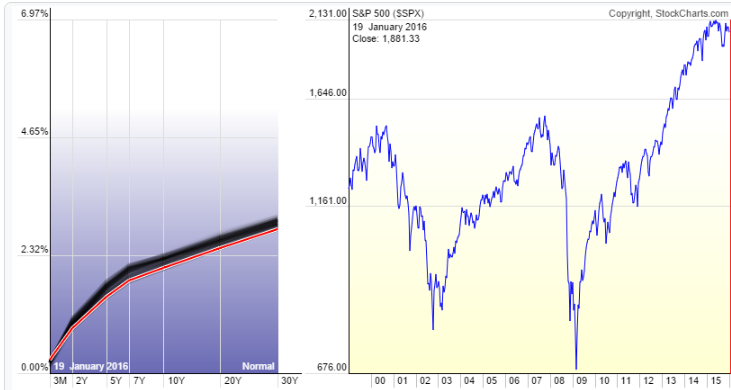
| The yield curve compares Treasury yields for bonds ranging from three months to 30 years on a concise chart. When the economy weakens, so does the demand for money, and longer-term yields fall. When they drop below three-month yields, the yield curve is said have become inverted. As the next chart (Figure 1) shows, as stock prices plummeted short-term yields remained well below long-term in the third week of January. So does this mean we are safe? |
|
| Figure 1. Yield curve on the left showing the S&P 500 Index on the right. |
| Graphic provided by: StockCharts.com. |
| |
| Before attempting to answer that question, let's compare this chart with charts showing the periods leading up to the last two official recessions. |
|
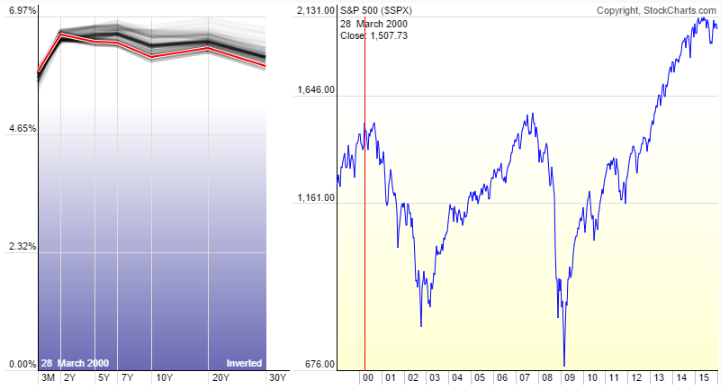
| Figure 2. Yield curve from March 2000 at the onset of the 2000 bear market and subsequent recession officially called in March 2001. |
| Graphic provided by: StockCharts.com. |
| |
| Between 1953 and 2009, a flattening yield curve provided warning in seven of the ten recessions. However, the advance warning period varied. In the last two shown in Figures 2 and 3, warnings ranged from one to nearly three years. But it's important to point out the fact that just because the curve isn't flat now doesn't necessarily mean a recession isn't coming. |
|
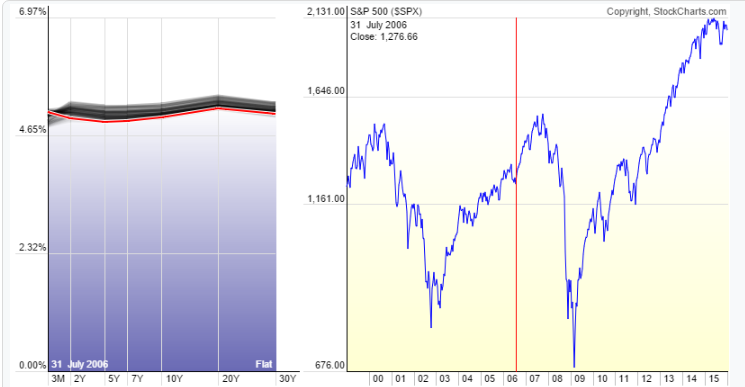
| Figure 3. The next time the yield curve flattened was in July 2006 before it again went inverted. A recession was not officially declared until June 2009. |
| Graphic provided by: StockCharts.com. |
| |
| There is another factor this time around. We have experienced unprecedented central bank stimulus since 2008 and that (may have) changed the yield curve dynamic. Never before in history have Federal Reserve Fed funds overnight rates remained mired near zero for so long. For the yield curve to flatten from here would require that either 1) long-term rates drop to nearly zero or 2) short-term rates rise. And the latter scenario is looking less likely given the deteriorating global economy. |
| Another indicator to watch is high-yield corporate bond rates. Currently, the iShares IBoxx High-Yield Bond ETF (HYG) price is trading at lows not seen since the last recession in 2009. A continued decline would indicate weakening demand for money and that would be bearish. By the time a recession is officially declared it's too late to protect our portfolios from it. What is far more important for the trader is identifying the strength of the preceding bear market. And a flattening yield curve is one indicator that helps us measure the potential strength and duration of each bear. |
Matt Blackman is a full-time technical and financial writer and trader. He produces corporate and financial newsletters, and assists clients in getting published in the mainstream media. He is the host of TradeSystemGuru.com. Matt has earned the Chartered Market Technician (CMT) designation. Find out what stocks and futures Matt is watching on Twitter at www.twitter.com/RatioTrade
| Company: | TradeSystemGuru.com |
| Address: | Box 2589 |
| Garibaldi Highlands, BC Canada | |
| Phone # for sales: | 604-898-9069 |
| Fax: | 604-898-9069 |
| Website: | www.tradesystemguru.com |
| E-mail address: | indextradermb@gmail.com |
Traders' Resource Links | |
| TradeSystemGuru.com has not added any product or service information to TRADERS' RESOURCE. | |
Click here for more information about our publications!
PRINT THIS ARTICLE

Request Information From Our Sponsors
- StockCharts.com, Inc.
- Candle Patterns
- Candlestick Charting Explained
- Intermarket Technical Analysis
- John Murphy on Chart Analysis
- John Murphy's Chart Pattern Recognition
- John Murphy's Market Message
- MurphyExplainsMarketAnalysis-Intermarket Analysis
- MurphyExplainsMarketAnalysis-Visual Analysis
- StockCharts.com
- Technical Analysis of the Financial Markets
- The Visual Investor
- VectorVest, Inc.
- Executive Premier Workshop
- One-Day Options Course
- OptionsPro
- Retirement Income Workshop
- Sure-Fire Trading Systems (VectorVest, Inc.)
- Trading as a Business Workshop
- VectorVest 7 EOD
- VectorVest 7 RealTime/IntraDay
- VectorVest AutoTester
- VectorVest Educational Services
- VectorVest OnLine
- VectorVest Options Analyzer
- VectorVest ProGraphics v6.0
- VectorVest ProTrader 7
- VectorVest RealTime Derby Tool
- VectorVest Simulator
- VectorVest Variator
- VectorVest Watchdog