HOT TOPICS LIST
- MACD
- Fibonacci
- RSI
- Gann
- ADXR
- Stochastics
- Volume
- Triangles
- Futures
- Cycles
- Volatility
- ZIGZAG
- MESA
- Retracement
- Aroon
INDICATORS LIST
LIST OF TOPICS
PRINT THIS ARTICLE
by Koos van der Merwe
The stock market has fallen heavily over the past few weeks. When will it start recovering?
Position: Accumulate
Koos van der Merwe
Has been a technical analyst since 1969, and has worked as a futures and options trader with First Financial Futures in Johannesburg, South Africa.
PRINT THIS ARTICLE
ELLIOTT WAVE
So, Is The Bottom Around The Corner?
01/20/16 03:06:05 PMby Koos van der Merwe
The stock market has fallen heavily over the past few weeks. When will it start recovering?
Position: Accumulate
| January 2016 has so far seen the worst decline in the stock market since — Some say 2008, others say sometime in the 20th century, but as far as we are concerned, does it matter when? In the world of today, there is chaos as bad, if not worse, than WWI and WWII. At least in those wars the world knew where the fighting took place, and sent in troops to defeat the enemy. Today, the enemy are terrorist groups all over the world, killing innocent people, from Syria to Africa to Asia. WWIII is as different from WWII as WWII differed from WWI. Also, the oil price is collapsing as Saudi Arabia thumbs its nose at Iran. Russia, whose main source of income is from oil, has a President Putin whose vanity threatens his decision on whether to bow to the West and accept President Obama's hand or thumb his nose. Today, with Syrian refugees flooding the West, from Europe to North America, many believing that Sharia law must become the law of the country that accepted them, what does the future hold? And so it goes on and on and on, and the stock market bows its head, and falls. |

|
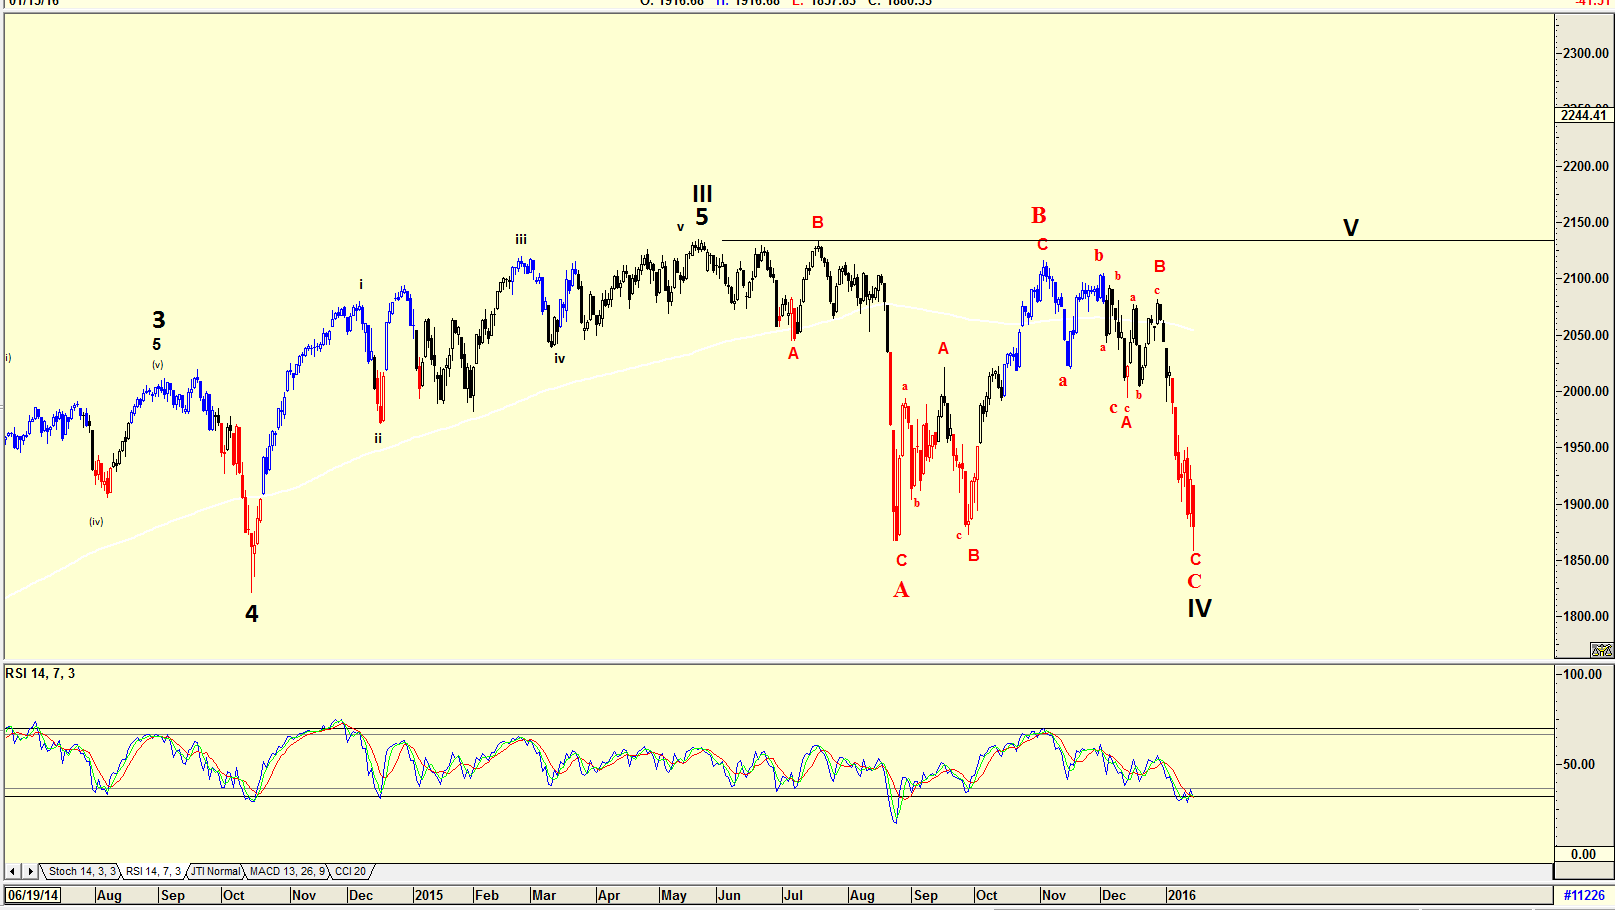
| Figure 1. Daily chart of the S&P500 Index. |
| Graphic provided by: AdvancedGET. |
| |
| The chart in Figure 1 is a daily chart of the S&P500 Index, with an Elliott Wave count suggesting that the index could be bottoming in a WAVE IV. Is this indeed a bottom? The RSI indicator shown on the chart suggests that this could indeed be the case, but with experts suggesting that oil could fall to $10 per barrel, with suicide bombers killing innocent's and with general market uncertainty, does one go out and catch a falling knife, or wait for a market bottom to confirm itself? The question of course is how? |

|
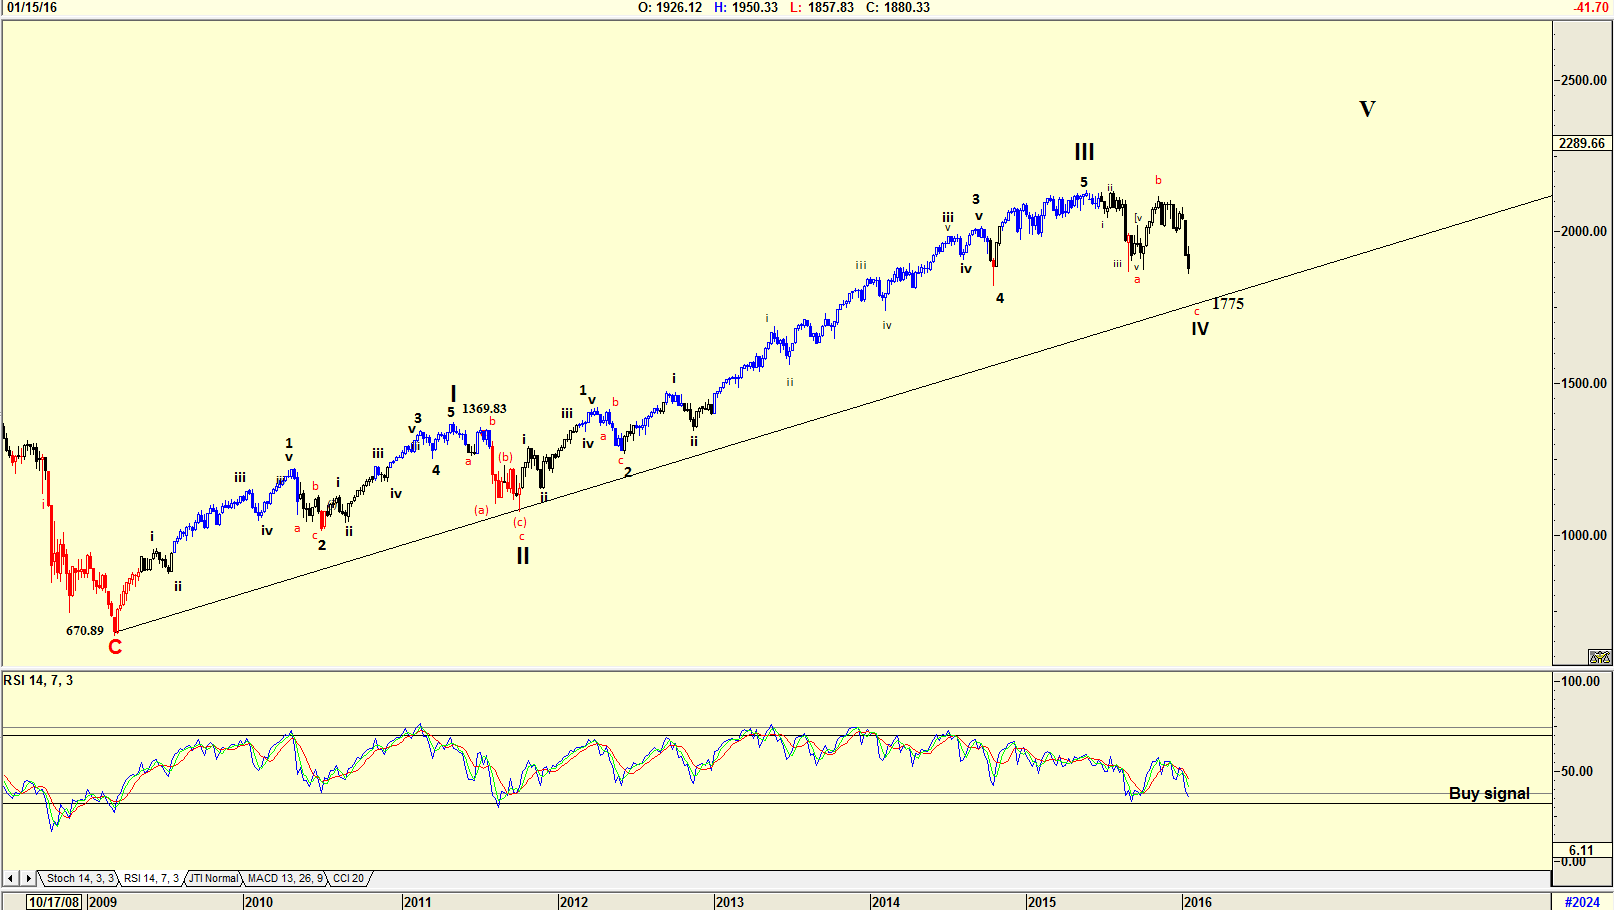
| Figure 2. Weekly chart of the S&P500 Index. |
| Graphic provided by: AdvancedGET. |
| |
| The chart in Figure 2 is a weekly chart of the S&P500 Index, with an Elliott Wave count suggesting that the index could fall to test the trendline at about 1775. That is a further fall of approximately 5.6% from its price of 1880.33 on Friday, January 15th. ((1880.33-1775)/1880.33 = 5.6%). Do note the RSI indicator which for a second time is at oversold levels. Should it start turning up, it could suggest a divergent buy, that is where the index falls lower, but the RSI bottoms are higher. This is a strong buy signal. |

|
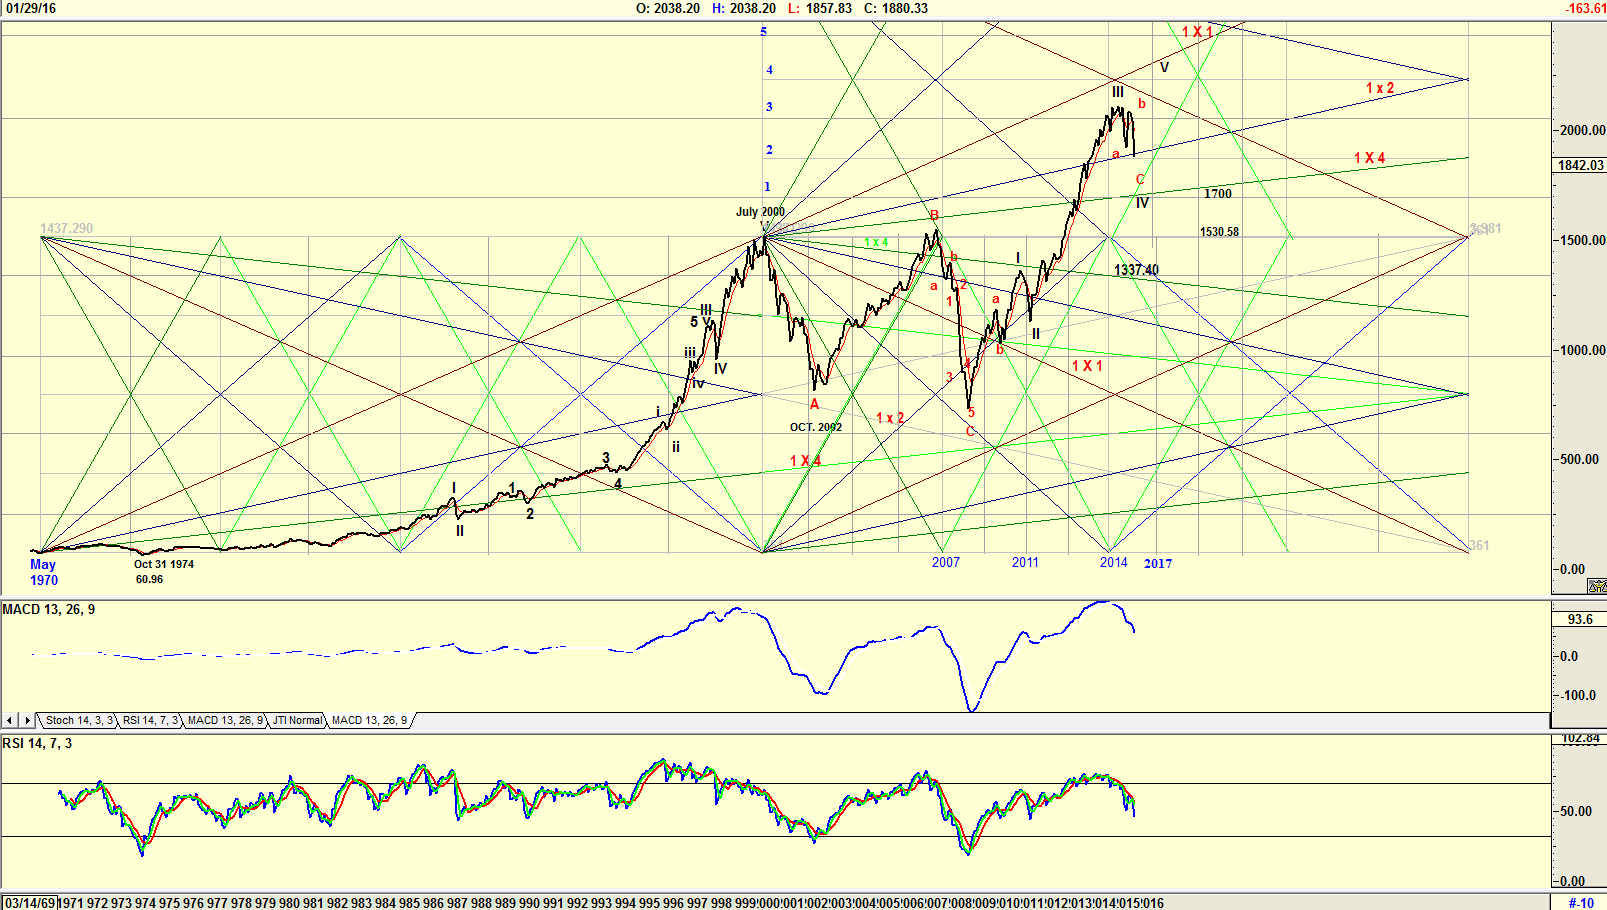
| Figure 3. Monthly chart of the S&P500 Index with Gann fans. |
| Graphic provided by: AdvancedGET. |
| |
| The chart in Figure 3 is a monthly chart of the S&P500 index, with a GANN fan drawn from May 1970. The Gann fan shows the index testing the horizontal line #2 and the 1X2 Gann angle. However both the MACD indicator and the RSI indicator are both suggesting further weakness. The index could fall to the 1x4 angle at 1700, however looking back at the indicators on the chart, one can see how the index can rise into a wave 5 even as the indicators are falling. This suggests that it is only when a wave 5 finalizes that the index falls. The world has become a mess. How to control ISIS, Al Quaeda, and all the other Muslim terrorist groups out there is giving many world leaders a sizable headache. In the United States of America, President Obama has this problem in his final year of office, or does he simply leave it to his successor to solve? With the oil price falling and with doom-and-gloom scaring investors, many are selling their shares. When will the market bottom? Charts are saying, 'soon', but investors are saying, 'I am scared'. So, should the indexes truly start recovering, expect it to be slow. |
Has been a technical analyst since 1969, and has worked as a futures and options trader with First Financial Futures in Johannesburg, South Africa.
| Address: | 3256 West 24th Ave |
| Vancouver, BC | |
| Phone # for sales: | 6042634214 |
| E-mail address: | petroosp@gmail.com |
Click here for more information about our publications!
Comments

Request Information From Our Sponsors
- StockCharts.com, Inc.
- Candle Patterns
- Candlestick Charting Explained
- Intermarket Technical Analysis
- John Murphy on Chart Analysis
- John Murphy's Chart Pattern Recognition
- John Murphy's Market Message
- MurphyExplainsMarketAnalysis-Intermarket Analysis
- MurphyExplainsMarketAnalysis-Visual Analysis
- StockCharts.com
- Technical Analysis of the Financial Markets
- The Visual Investor
- VectorVest, Inc.
- Executive Premier Workshop
- One-Day Options Course
- OptionsPro
- Retirement Income Workshop
- Sure-Fire Trading Systems (VectorVest, Inc.)
- Trading as a Business Workshop
- VectorVest 7 EOD
- VectorVest 7 RealTime/IntraDay
- VectorVest AutoTester
- VectorVest Educational Services
- VectorVest OnLine
- VectorVest Options Analyzer
- VectorVest ProGraphics v6.0
- VectorVest ProTrader 7
- VectorVest RealTime Derby Tool
- VectorVest Simulator
- VectorVest Variator
- VectorVest Watchdog
