

HOT TOPICS LIST
- MACD
- Fibonacci
- RSI
- Gann
- ADXR
- Stochastics
- Volume
- Triangles
- Futures
- Cycles
- Volatility
- ZIGZAG
- MESA
- Retracement
- Aroon
INDICATORS LIST
LIST OF TOPICS
PRINT THIS ARTICLE
by Chaitali Mohile
Amazon.com is weathering the storm of high volatility in the global financial market.
Position: N/A
Chaitali Mohile
Active trader in the Indian stock markets since 2003 and a full-time writer. Trading is largely based upon technical analysis.
PRINT THIS ARTICLE
TECHNICAL ANALYSIS
Amazon: A Strong Stock
01/20/16 02:45:35 PMby Chaitali Mohile
Amazon.com is weathering the storm of high volatility in the global financial market.
Position: N/A
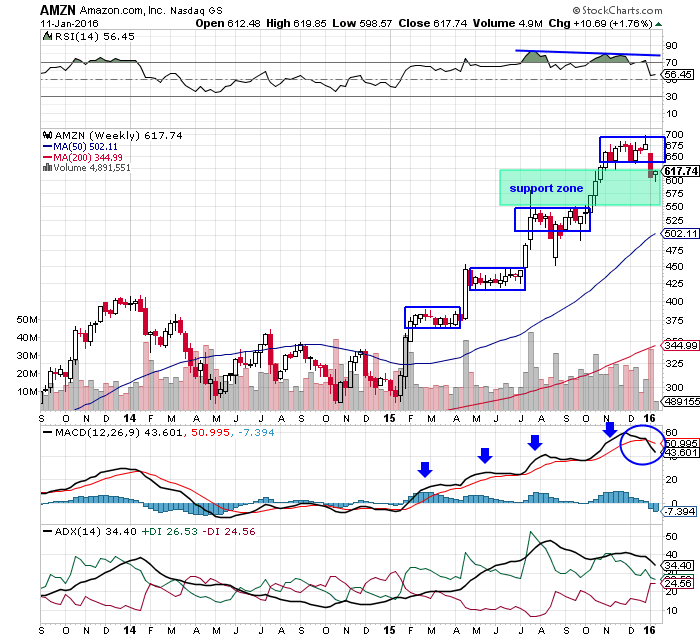
| Since January 2015, Amazon.com (AMZN) has followed a bullish pattern to conquer the new highs. After each upward movement, the stock consolidated and gathered strength for a future rally. This formed a series of bullish flag & pennant continuation patterns on the weekly time frame chart in Figure 1. During the sideways movement, the moving average convergence divergence (MACD)(12,26,9) retraced marginally towards the signal line for the support. The average directional index (ADX)(14) gradually turned stronger, developing a fresh uptrend for AMZN. The stock has been in strong uptrend for almost a year. |
| However, the increasing uncertainty in the financial markets across the globe has poured high volatility in the stock. Though AMZN is consolidating at its new high, the price rally is not as stable as before. We can see many small doji candlesticks and the candles with upper shadows in the horizontal range. In addition, the relative strength index (RSI)(14) is showing negative divergence, and the MACD(12,26,9) has turned jittery in the positive territory. As a result, the stock has slipped a few levels from the top. But the strength in the main trend is likely to remain unharmed. |
|
| Figure 1. Weekly Chart of Amazon.com (AMZN). The regular appearance of bullish flag & pennant patterns is showing reliability and bullish sentiments in AMZN. |
| Graphic provided by: StockCharts.com. |
| |
| All three indicators in Figure 1 are well placed in their bullish areas. The price rally also has various strong supports in the price chart. Therefore, the global uncertainty could hardly affect the stability of the AMZN. In fact, the stock would open a fresh buying opportunity once the RSI(14) establishes support at the center line (50 levels). |
|
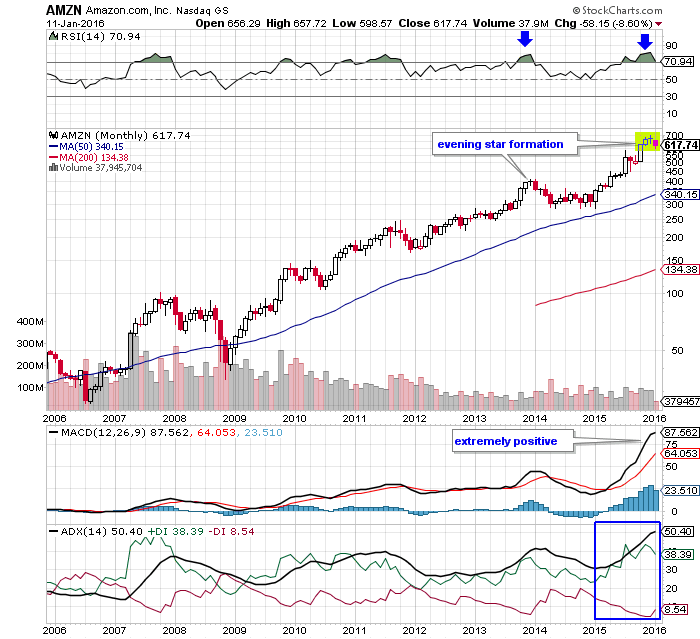
| Figure 2. Monthly Chart Of Amazon.com. An evening star candlestick pattern and highly overheated indicators are suggesting a trend reversal possibility for AMZN. |
| Graphic provided by: StockCharts.com. |
| |
| The technical indicators are highly overbought on the monthly chart. AMZN formed a bearish reversal candlestick formation — an evening star on the price chart as the RSI(14) turned overbought. The ADX(14) is overheated at 50 levels, indicating a trend reversal possibility. The MACD(12,26,9) is extremely positive at the current level. These trend reversal signals confirm the bearish candlestick pattern. In such scenario, the stock is likely to undergo an intermediate technical correction that would drag down all the indicators to a comfortable bullish level. |
| The previous bearish reversal rally established support immediately without causing any damage to the bullish trend. Therefore, we can anticipate that the stock is likely to follow the same pattern. Thus, AMZN would continue to remain strong even after this marginal downside rally. A new pull back rally would initiate a fresh buying opportunity in AMZN. |
Active trader in the Indian stock markets since 2003 and a full-time writer. Trading is largely based upon technical analysis.
| Company: | Independent |
| Address: | C1/3 Parth Indraprasth Towers. Vastrapur |
| Ahmedabad, Guj 380015 | |
| E-mail address: | chaitalimohile@yahoo.co.in |
Traders' Resource Links | |
| Independent has not added any product or service information to TRADERS' RESOURCE. | |
Click here for more information about our publications!
PRINT THIS ARTICLE

Request Information From Our Sponsors
- StockCharts.com, Inc.
- Candle Patterns
- Candlestick Charting Explained
- Intermarket Technical Analysis
- John Murphy on Chart Analysis
- John Murphy's Chart Pattern Recognition
- John Murphy's Market Message
- MurphyExplainsMarketAnalysis-Intermarket Analysis
- MurphyExplainsMarketAnalysis-Visual Analysis
- StockCharts.com
- Technical Analysis of the Financial Markets
- The Visual Investor
- VectorVest, Inc.
- Executive Premier Workshop
- One-Day Options Course
- OptionsPro
- Retirement Income Workshop
- Sure-Fire Trading Systems (VectorVest, Inc.)
- Trading as a Business Workshop
- VectorVest 7 EOD
- VectorVest 7 RealTime/IntraDay
- VectorVest AutoTester
- VectorVest Educational Services
- VectorVest OnLine
- VectorVest Options Analyzer
- VectorVest ProGraphics v6.0
- VectorVest ProTrader 7
- VectorVest RealTime Derby Tool
- VectorVest Simulator
- VectorVest Variator
- VectorVest Watchdog