HOT TOPICS LIST
- MACD
- Fibonacci
- RSI
- Gann
- ADXR
- Stochastics
- Volume
- Triangles
- Futures
- Cycles
- Volatility
- ZIGZAG
- MESA
- Retracement
- Aroon
INDICATORS LIST
LIST OF TOPICS
PRINT THIS ARTICLE
by Koos van der Merwe
The Elliott wave has become a signpost in the wilderness, and the sign, just down the road, has changed.
Position: Accumulate
Koos van der Merwe
Has been a technical analyst since 1969, and has worked as a futures and options trader with First Financial Futures in Johannesburg, South Africa.
PRINT THIS ARTICLE
ELLIOTT WAVE
The Signpost Has Changed
01/13/16 04:08:10 PMby Koos van der Merwe
The Elliott wave has become a signpost in the wilderness, and the sign, just down the road, has changed.
Position: Accumulate
| With computers becoming more and more active in the market, Elliott wave analysis is becoming a signpost in the market wilderness, and that signpost can change its reading a little way down the road. This has just recently occurred, where the signpost has changed from a bullish reading to what has now become a bearish reading. |

|
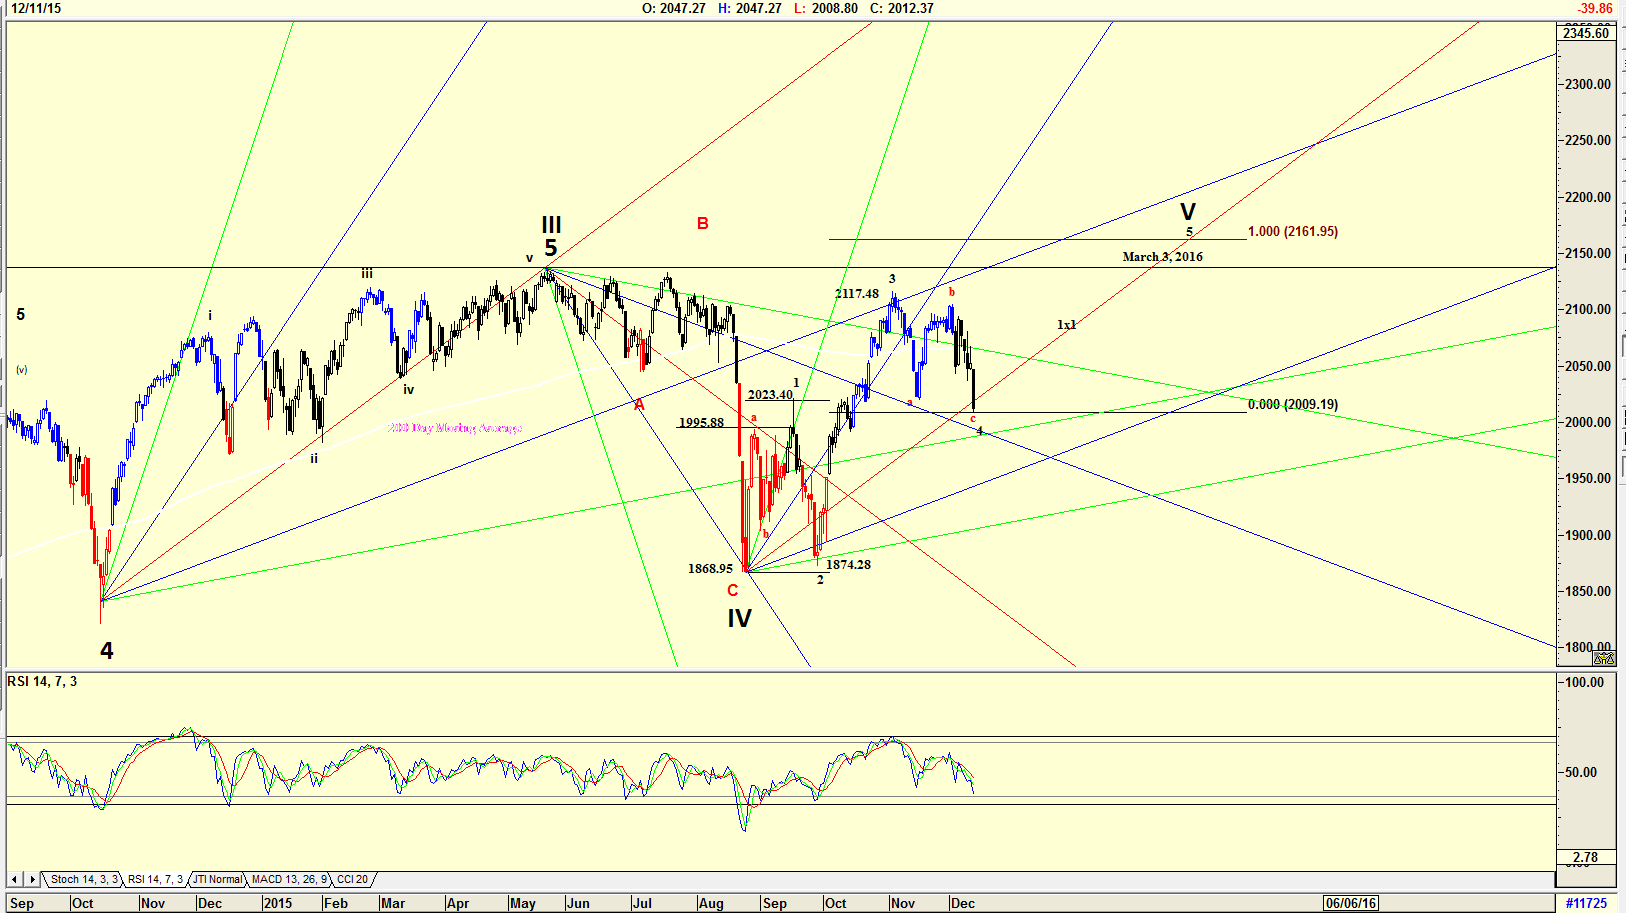
| Figure 1. Daily chart of S&P500 Index of December 2015. |
| Graphic provided by: AdvancedGET. |
| |
| The chart in Figure 1 is an Elliott wave analysis of the S&P 500 Index as I analyzed it during December 2015. Note that the correction had not fallen below the high of Wave 1 of WAVE V suggesting that this was a Wave 4 of WAVE V and that the Index should start rising with a target of 2161.95 by March 3, 2016, give or take a few weeks. With the market collapse during the week of January 4th to January 8th, the Elliott wave count has changed as shown in Figure 2. |

|
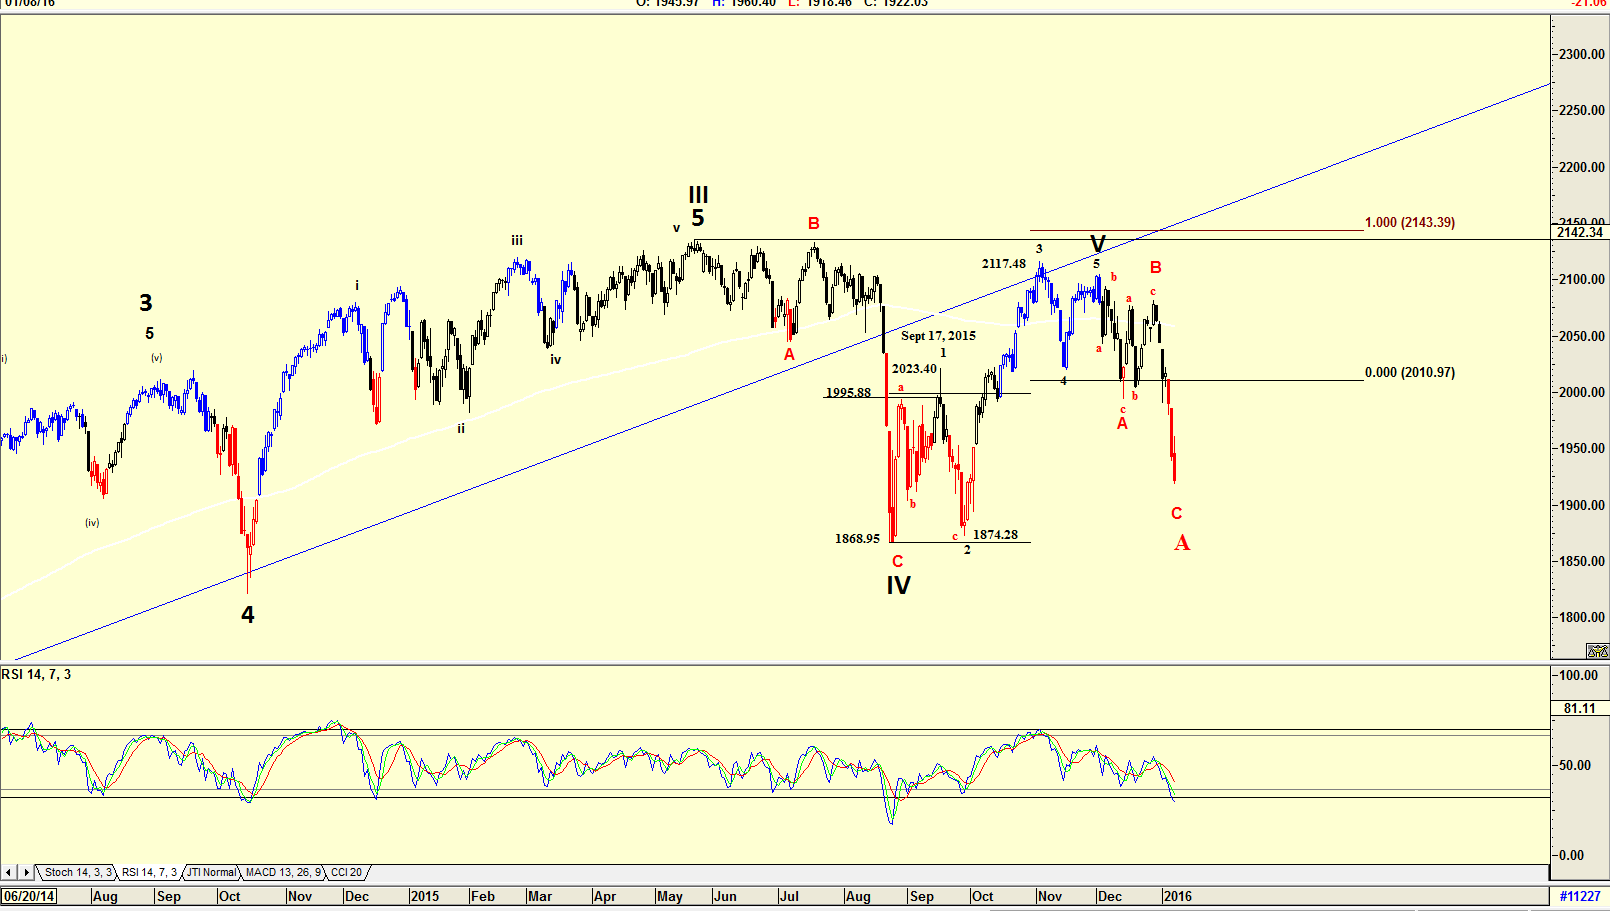
| Figure 2. Daily chart of S&P500 Index as of January 8, 2016. |
| Graphic provided by: AdvancedGET. |
| |
| The chart in Figure 2 is a chart showing how the share price has fallen below the 2023.40 level of the wave 1 high of the September 17, 2015. The Elliott wave rule is that a wave 4 should not fall below the high of wave 1. Should that occur, then a recount of the Elliott waves should be done. The recount shown in Figure 2 suggests that Wave 5 of WAVE V was a failure, and that the index is falling in a Wave C of what could possibly be a WAVE A. Should this be true, then a WAVE B up could start in the near future. However, the RSI indicator is still trending down, suggesting that a WAVE A bottom has not been finalized, but the fact that the RSI indicator is at oversold levels, suggests that the bottom could occur in the not too distant future. |

|
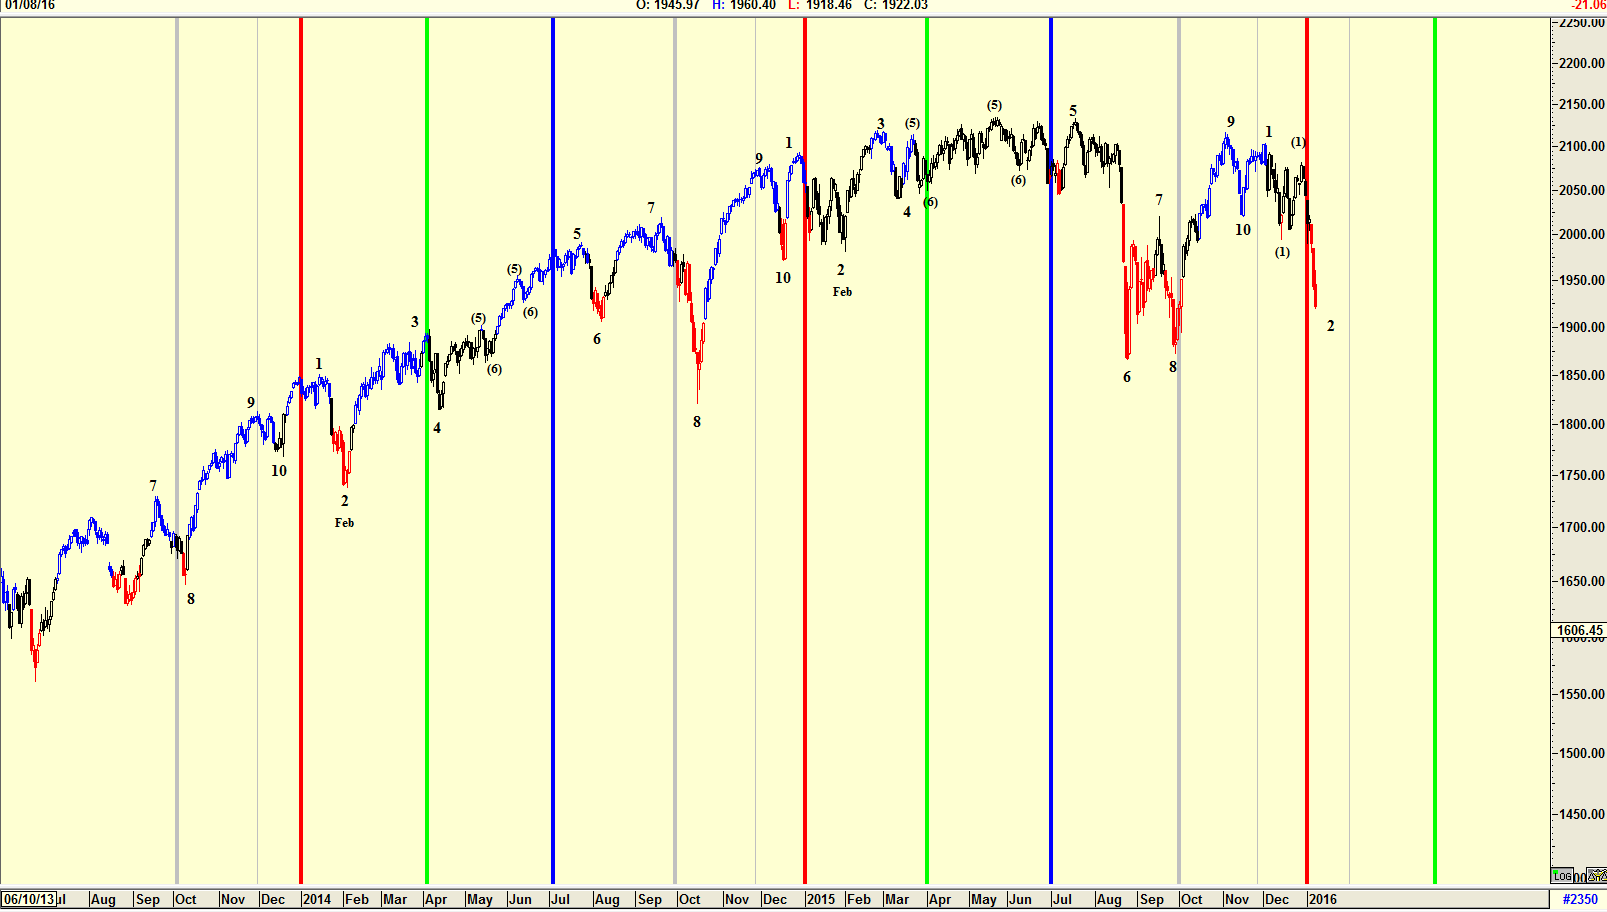
| Figure 3. Daily Paget cycle chart of the S&P500 Index. |
| Graphic provided by: AdvancedGET. |
| |
| Figure 3 is a daily chart of the S&P500 index with a Paget cycle showing an anticipated fall in the index as the year 2016 started. The cycle does suggest that a wave 2 correction upwards could occur in the near future. A look back at previous Wave 2's show that a wave 2 bottom was inclined to occur towards end of January and start of February. With the RSI in Figure 2 not yet suggesting a buy, the Paget cycle suggesting that a rise in the index could only start towards the end of January looks true. The Paget cycle, as shown on the chart, is a quarterly repetition. The Elliott wave count has today become a signpost in the wilderness, with a count changing a little way down the road at the next signpost. The charts above are suggesting that a WAVE B Bear market correction could soon start happening. The trend will be up, but one should never forget that according to the new Elliott wave signpost, and the Paget cycle, the trend would be a bear market correction, and not a bull market rise, until of course the next Elliott wave signpost, a little way down the road. |
Has been a technical analyst since 1969, and has worked as a futures and options trader with First Financial Futures in Johannesburg, South Africa.
| Address: | 3256 West 24th Ave |
| Vancouver, BC | |
| Phone # for sales: | 6042634214 |
| E-mail address: | petroosp@gmail.com |
Click here for more information about our publications!
Comments

Request Information From Our Sponsors
- StockCharts.com, Inc.
- Candle Patterns
- Candlestick Charting Explained
- Intermarket Technical Analysis
- John Murphy on Chart Analysis
- John Murphy's Chart Pattern Recognition
- John Murphy's Market Message
- MurphyExplainsMarketAnalysis-Intermarket Analysis
- MurphyExplainsMarketAnalysis-Visual Analysis
- StockCharts.com
- Technical Analysis of the Financial Markets
- The Visual Investor
- VectorVest, Inc.
- Executive Premier Workshop
- One-Day Options Course
- OptionsPro
- Retirement Income Workshop
- Sure-Fire Trading Systems (VectorVest, Inc.)
- Trading as a Business Workshop
- VectorVest 7 EOD
- VectorVest 7 RealTime/IntraDay
- VectorVest AutoTester
- VectorVest Educational Services
- VectorVest OnLine
- VectorVest Options Analyzer
- VectorVest ProGraphics v6.0
- VectorVest ProTrader 7
- VectorVest RealTime Derby Tool
- VectorVest Simulator
- VectorVest Variator
- VectorVest Watchdog
