HOT TOPICS LIST
- MACD
- Fibonacci
- RSI
- Gann
- ADXR
- Stochastics
- Volume
- Triangles
- Futures
- Cycles
- Volatility
- ZIGZAG
- MESA
- Retracement
- Aroon
INDICATORS LIST
LIST OF TOPICS
PRINT THIS ARTICLE
by Koos van der Merwe
Deteriorating Credit Markets - Harbinger of Recession.
Position: Accumulate
Koos van der Merwe
Has been a technical analyst since 1969, and has worked as a futures and options trader with First Financial Futures in Johannesburg, South Africa.
PRINT THIS ARTICLE
TECHNICAL ANALYSIS
The Canadian Stock Market
12/30/15 04:48:25 PMby Koos van der Merwe
Deteriorating Credit Markets - Harbinger of Recession.
Position: Accumulate
| The above is from an email I received on Sunday, December 27th from a very reputable Investment Management company. "The high-yield (junk) bond space has been under legitimate pressure over the last few months, and there may be even more trouble ahead." They continue by writing, "... deteriorating credit markets have been a harbinger for a peaking economy, which would indicate that a recession could be coming." Could they be correct in their forecast? My last two articles to Traders.com where I concluded that the Elliott Wave analysis of the S&P500 Index could be in a Wave 5 of WAVE V. This means that a major correction could well be on the cards. Gann analysis shows that this correction could start sometime in March 2016, give or take a month or two. So, strictly speaking, this Wave 5 of WAVE V rise, provides an opportunity to sell into strength, leaving the last 10% of course to the risk taker. If selling out of your portfolio, the question then arises as to where do you put your money? Under the mattress, or could you consider investing in interest or solid dividend paying stocks, or even gold shares if you believe that gold has bottomed? Then again there is the Canadian stock market. |

|
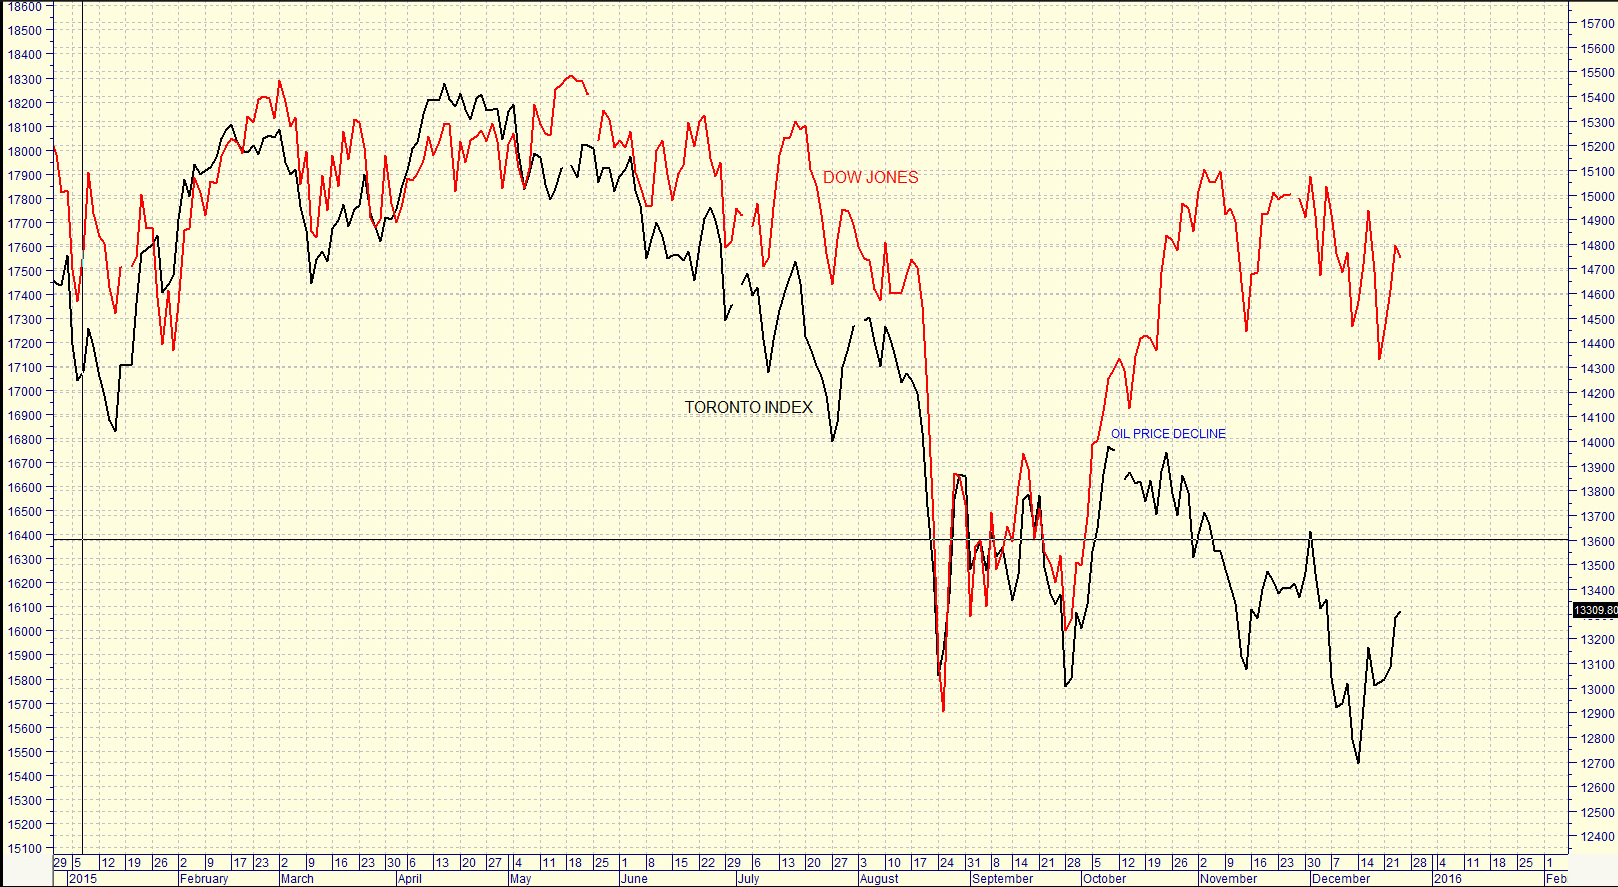
| Figure 1. Dow Jones with Toronto Index. |
| Graphic provided by: MetaStock. |
| |
| My chart in Figure 1 is a chart showing the Dow Jones and the Toronto Stock exchange index. Notice how the Dow and the Toronto Index moved together until the Oil price started falling. The Toronto Index fell to new lows, while the Dow continued higher. With interest rates rising in the US, the Canadian dollar has also fallen heavily against the US dollar. At the time of writing, the USD/CAD is 1.3881. This means that the C$ has fallen approximately 37% against the US$ in 2015. As the US Federal Reserve increases rates in 2016, as they have said they would, the C$ could fall even further against the US$. So, if you do decide to go Canadian, what do you invest in? |

|
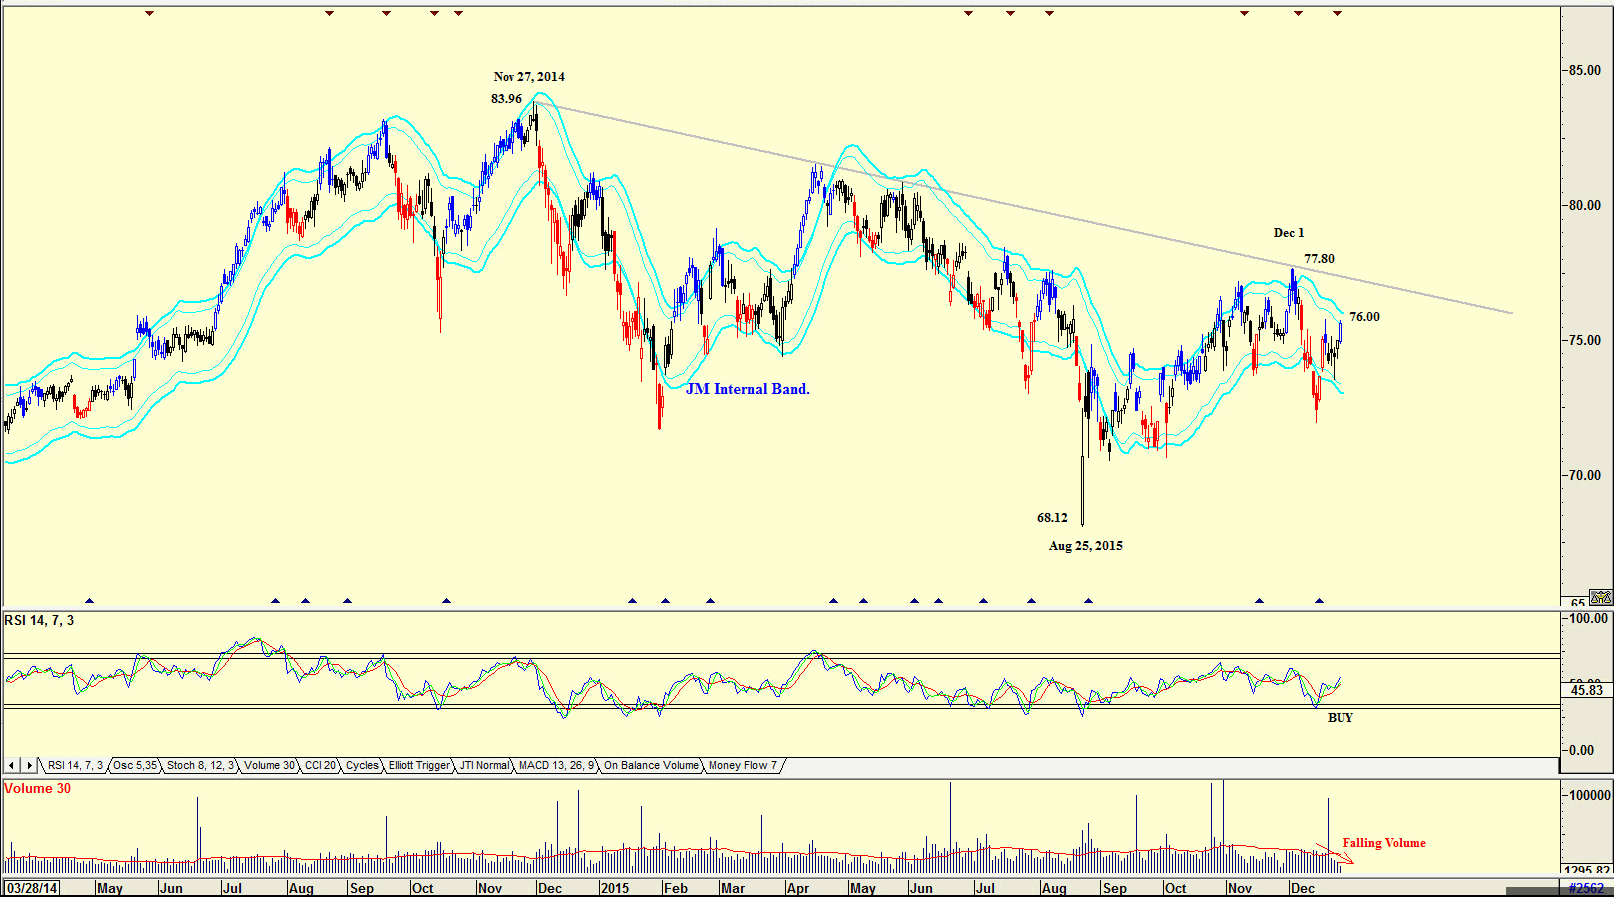
| Figure 2. Royal Bank of Canada. |
| Graphic provided by: AdvancedGET. |
| |
| With a weakening C$ to the US$, Canadian businesses, especially those that export from Canada to the United States, will have sales increasing. Also less Canadians will cross the border into the USA to purchase merchandise. Looking for Canadian companies that pay a strong dividend is therefore attractive, and one such company is Royal Bank of Canada. The bank currently has a dividend yield of 4.24%, with an EPS of 4.86. Not wonderful, but attractive and in a solid company. The chart in Figure 1 is a daily chart showing how the price peaked at $83.96 on November 27 2014, and then fell to a low of $68.12 by August 25th, 2015. From that level, the price rose to test the resistance line at $77.80 by December 1st 2015. The share at the time of writing is trading at $76. With the RSI trending up, traders could buy at the present price. Investors however could wait for the share price to rise above the JM internal upper band. The JM internal band is a 15 period simple moving average offset by 2% positive and 2% negative. A move above the upper band suggests a buy, and below the lower band, a sell. One negative is the falling volume as the price rose. |

|
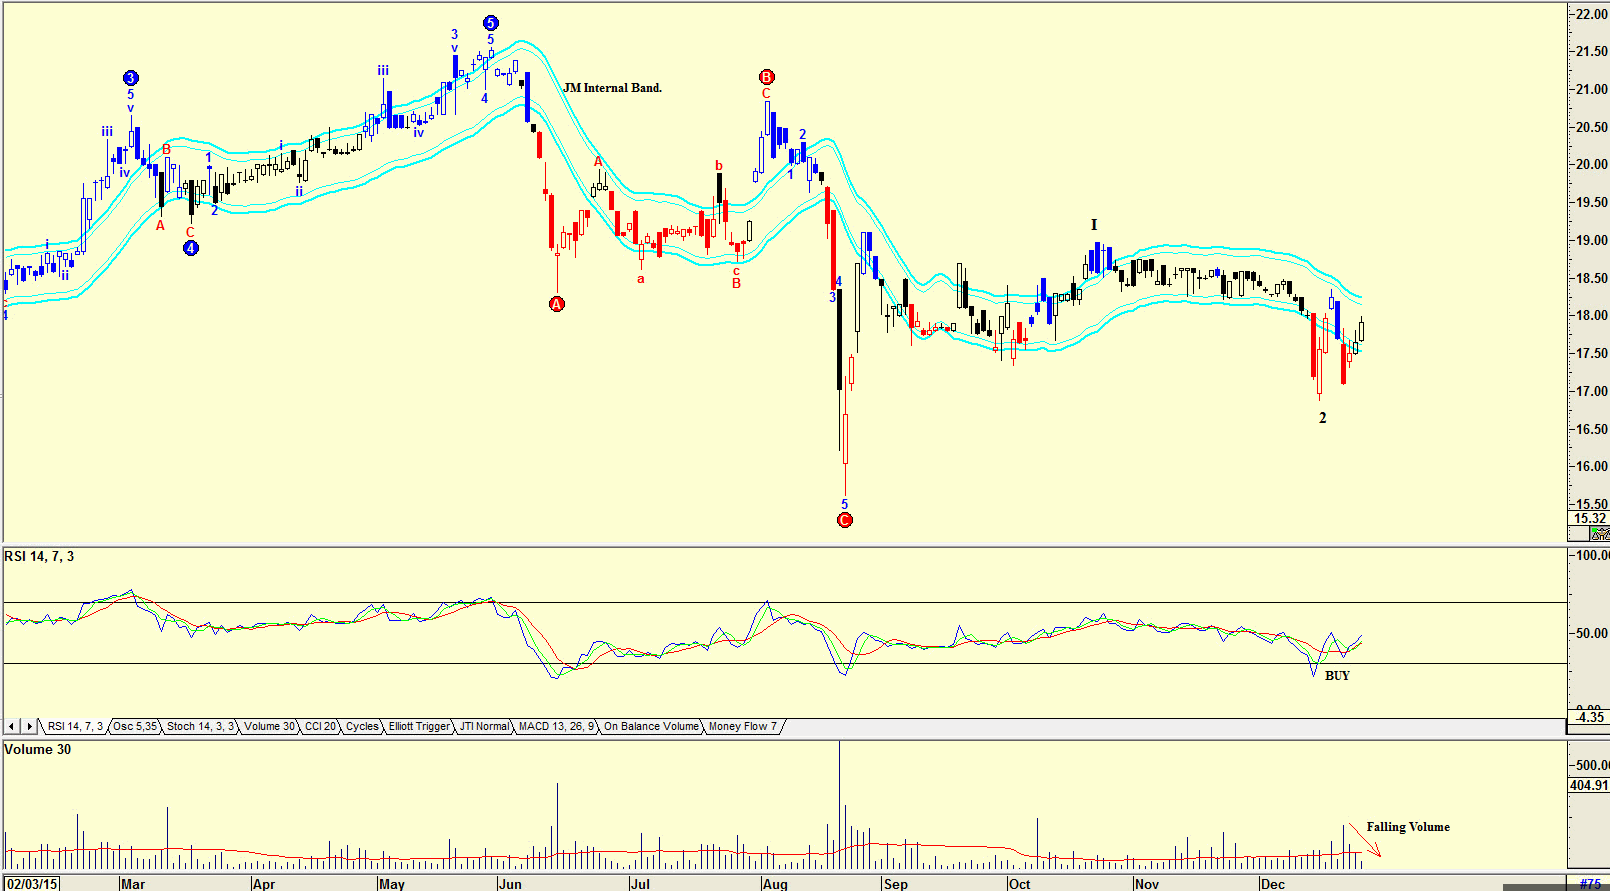
| Figure 3. The KEG Royalties Income Fund. |
| Graphic provided by: AdvancedGET. |
| |
| Another share that pays a good dividend is The KEG Royalties Income Fund. The yield is presently at 5.86%. The chart in Figure 3 is a daily chart with an Elliott wave count suggesting that the share price has completed a Wave 2. This is confirmed by the RSI indicator which has given a buy signal and is trending up. Once again traders could buy at the current price while investors could wait for a move above the upper JM internal band. Once again the negative is falling volume as the price rose. There are many Canadian shares that offer a yield/dividend above 5%. With the Canadian Dollar as weak as it is and expected to weaken further, should the Oil price continue falling, and should Janet Yellen stick to her strategy of raising interest rates in the US, buying solid Canadian Companies with a strong US$ could be a comfortable strategy should the market in the United States fall into recession. The oil price sometime in the future will find a bottom and start rising. When that occurs, so will the Canadian Stock market. |
Has been a technical analyst since 1969, and has worked as a futures and options trader with First Financial Futures in Johannesburg, South Africa.
| Address: | 3256 West 24th Ave |
| Vancouver, BC | |
| Phone # for sales: | 6042634214 |
| E-mail address: | petroosp@gmail.com |
Click here for more information about our publications!
PRINT THIS ARTICLE

|

Request Information From Our Sponsors
- VectorVest, Inc.
- Executive Premier Workshop
- One-Day Options Course
- OptionsPro
- Retirement Income Workshop
- Sure-Fire Trading Systems (VectorVest, Inc.)
- Trading as a Business Workshop
- VectorVest 7 EOD
- VectorVest 7 RealTime/IntraDay
- VectorVest AutoTester
- VectorVest Educational Services
- VectorVest OnLine
- VectorVest Options Analyzer
- VectorVest ProGraphics v6.0
- VectorVest ProTrader 7
- VectorVest RealTime Derby Tool
- VectorVest Simulator
- VectorVest Variator
- VectorVest Watchdog
- StockCharts.com, Inc.
- Candle Patterns
- Candlestick Charting Explained
- Intermarket Technical Analysis
- John Murphy on Chart Analysis
- John Murphy's Chart Pattern Recognition
- John Murphy's Market Message
- MurphyExplainsMarketAnalysis-Intermarket Analysis
- MurphyExplainsMarketAnalysis-Visual Analysis
- StockCharts.com
- Technical Analysis of the Financial Markets
- The Visual Investor
