HOT TOPICS LIST
- MACD
- Fibonacci
- RSI
- Gann
- ADXR
- Stochastics
- Volume
- Triangles
- Futures
- Cycles
- Volatility
- ZIGZAG
- MESA
- Retracement
- Aroon
INDICATORS LIST
LIST OF TOPICS
PRINT THIS ARTICLE
by Koos van der Merwe
Ralph Elliott had rules to follow when preparing an Elliott Wave.
Position: Accumulate
Koos van der Merwe
Has been a technical analyst since 1969, and has worked as a futures and options trader with First Financial Futures in Johannesburg, South Africa.
PRINT THIS ARTICLE
ELLIOTT WAVE
The Elliott Wave Rule
12/23/15 01:11:36 PMby Koos van der Merwe
Ralph Elliott had rules to follow when preparing an Elliott Wave.
Position: Accumulate
| We all know who Ralph N Elliott was and the Elliott Wave theory that he developed. With the recent downturn in the market caused by the falling oil price, the attacks in Paris and then again in California, applying Elliott Wave analysis to what the future holds for the economy has become a must. |

|
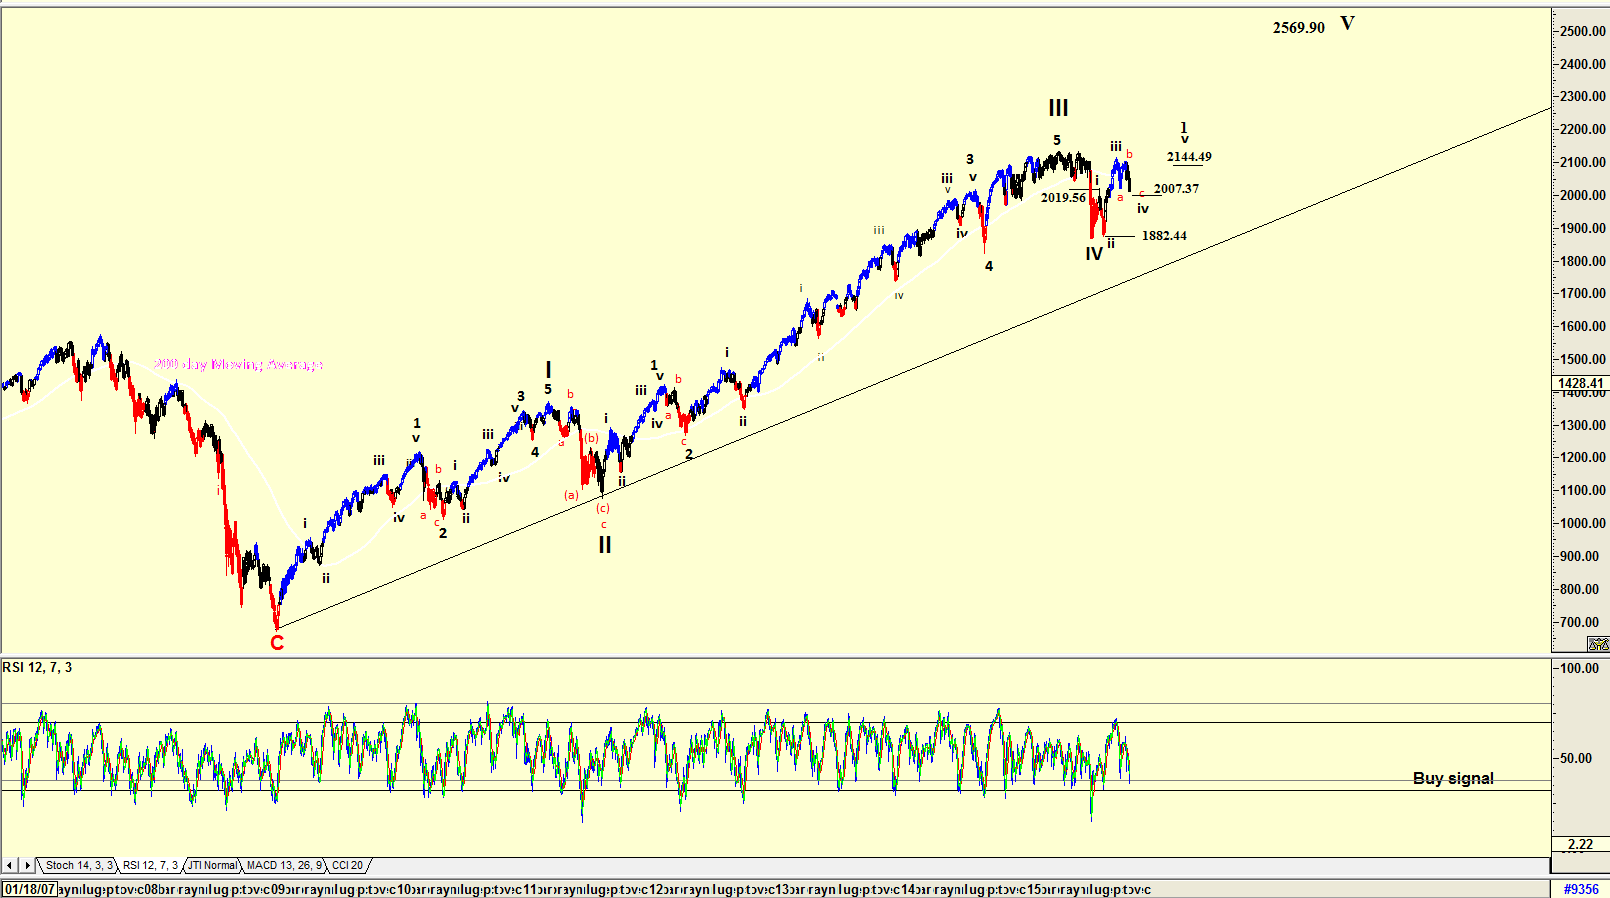
| Figure 1. Weekly Elliott Wave count of the S&P500 Index. |
| Graphic provided by: AdvancedGET. |
| |
| The chart in Figure 1 is a weekly chart with an Elliott Wave count of the S&P500 Index. The chart shows an Elliott Wave count suggesting that the index could be a wave iv of a WAVE V. Now the Elliott Wave rule is that a WAVE V should be equal to a WAVE I, which means that the WAVE V should top out at 2569.90 (1369.83-670.89=698.94+1870.96=2569.90). The RSI indicator is trending upwards suggesting that this could well occur. |

|
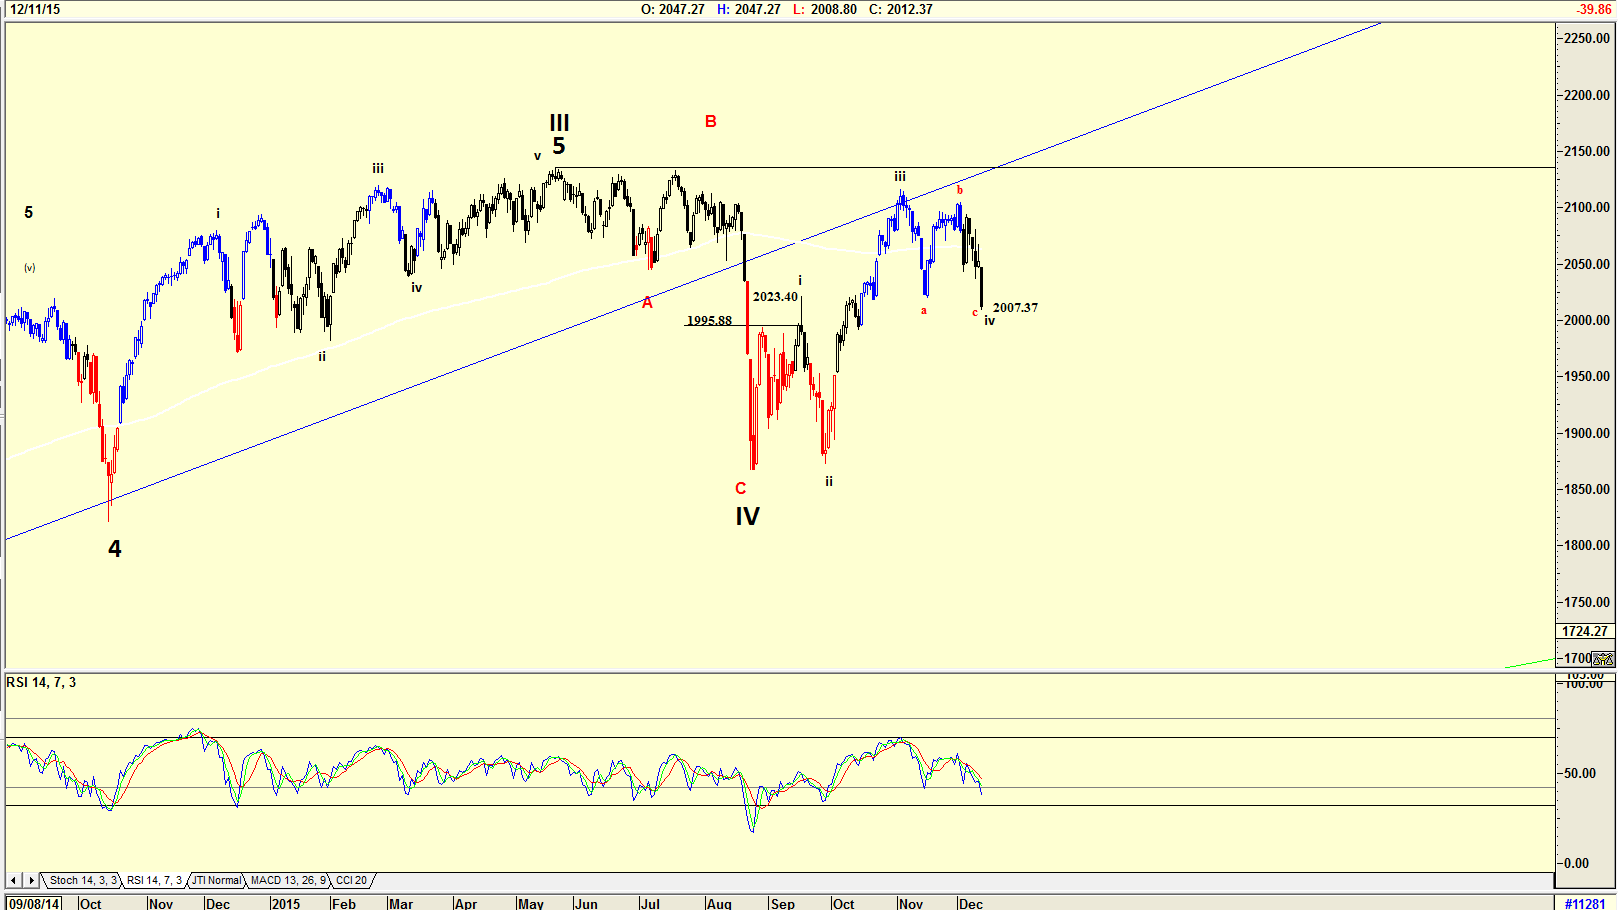
| Figure 2. Daily chart of the S&P 500 Index. |
| Graphic provided by: AdvancedGET. |
| |
| The daily chart in Figure 2 has an Elliott Wave count suggesting that the index could be completing a wave iv of what could be a Wave 1 of WAVE V. This count is a possibility because the weekly chart is suggesting that WAVE V should rise to 2569.90. Do note, once again, the RSI, which on the daily chart has also fallen to oversold levels. The index however could mess around at present levels to establish a solid base before rising to wave v of Wave 1. Do notice how simple wave 2 of Wave 1 is on the chart, suggesting that wave iv of Wave 1 had to be complicated, which is what has happened. With wave i of Wave 1 being 137.12 in length (2019.56-1882.44=137.12), we can add that length to the low of wave iv of Wave 1 and we receive the projected target of 2144.49 for wave v of Wave 1. |

|
| Figure 3. Enlarged daily chart with an Elliott count. |
| Graphic provided by: AdvancedGET. |
| |
| Of course wave iv of Wave 1 could fall further, but at 2007.37 it has fallen below the high of wave I of Wave 1. That is unusual, because the Elliott rule is that a wave 4 should not fall below the high of wave 1. The chart in Figure 3, an enlarged daily chart, shows that the index could have topped out in a wave I at 1995.88, a figure below the low of 2007.37. Should this indeed be the case, then we could soon see the start of wave v of Wave 1. World events and the falling price of oil has caused the market to fall dramatically. Elliott Wave analysis suggests that the market should start rising. Let us hope that we all receive a Xmas present with a 2015 Xmas rally. |
Has been a technical analyst since 1969, and has worked as a futures and options trader with First Financial Futures in Johannesburg, South Africa.
| Address: | 3256 West 24th Ave |
| Vancouver, BC | |
| Phone # for sales: | 6042634214 |
| E-mail address: | petroosp@gmail.com |
Click here for more information about our publications!
Comments
Date: 12/24/15Rank: 1Comment: How it is possible that a P3 wave that has taken 3 years and half to deploy, has been corrected by a P4 of just four months ???

Request Information From Our Sponsors
- StockCharts.com, Inc.
- Candle Patterns
- Candlestick Charting Explained
- Intermarket Technical Analysis
- John Murphy on Chart Analysis
- John Murphy's Chart Pattern Recognition
- John Murphy's Market Message
- MurphyExplainsMarketAnalysis-Intermarket Analysis
- MurphyExplainsMarketAnalysis-Visual Analysis
- StockCharts.com
- Technical Analysis of the Financial Markets
- The Visual Investor
- VectorVest, Inc.
- Executive Premier Workshop
- One-Day Options Course
- OptionsPro
- Retirement Income Workshop
- Sure-Fire Trading Systems (VectorVest, Inc.)
- Trading as a Business Workshop
- VectorVest 7 EOD
- VectorVest 7 RealTime/IntraDay
- VectorVest AutoTester
- VectorVest Educational Services
- VectorVest OnLine
- VectorVest Options Analyzer
- VectorVest ProGraphics v6.0
- VectorVest ProTrader 7
- VectorVest RealTime Derby Tool
- VectorVest Simulator
- VectorVest Variator
- VectorVest Watchdog
