HOT TOPICS LIST
- MACD
- Fibonacci
- RSI
- Gann
- ADXR
- Stochastics
- Volume
- Triangles
- Futures
- Cycles
- Volatility
- ZIGZAG
- MESA
- Retracement
- Aroon
INDICATORS LIST
LIST OF TOPICS
PRINT THIS ARTICLE
by Koos van der Merwe
I have followed QLT Inc. for many years. It is a pharmaceutical company that is sitting on $300 million in cash and no debt. The share price reached a high of $85.75 on January 24, 2001 and is now trading at $9.44. Is it worth a BUY?
Position: Hold
Koos van der Merwe
Has been a technical analyst since 1969, and has worked as a futures and options trader with First Financial Futures in Johannesburg, South Africa.
PRINT THIS ARTICLE
BREAKOUTS
QLT Inc. and Comfort Paramenters
11/22/02 10:06:41 AMby Koos van der Merwe
I have followed QLT Inc. for many years. It is a pharmaceutical company that is sitting on $300 million in cash and no debt. The share price reached a high of $85.75 on January 24, 2001 and is now trading at $9.44. Is it worth a BUY?
Position: Hold
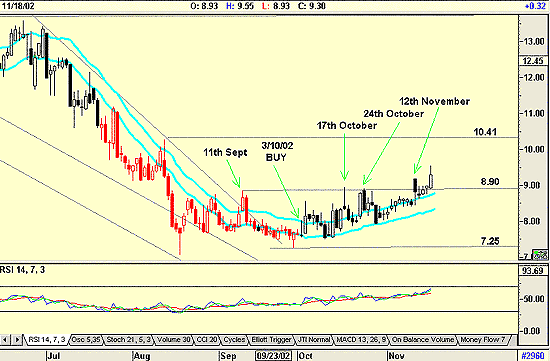
| Figure 1 shows a JM buy signal was given for QLT Inc. (QLTI) on October 3, 2002. Since then the share has crept up slowly with not much enthusiasm. On October 17, the share tested a major resistance level of $8.90, and fell back. It retested this resistance level again on October 24, and broke through it on its third attempt on the 12th of November. Then, as though it was doubtful about its move, the stock fell back below this level for two days before deciding to continue moving upwards. |
| If I looked at the movement of the share from the resistance level of $8.90 that occured on September 11th as a cup and handle formation, then I can calculate a target for QLT of $10.55, ($8.90 - $7.25 = $1.65. $8.90 + $1.65 = $10.55). This is greater than the next resistance level of $10.41. My stop-loss, should I purchase at $9.47, would be $8.53, ($9.47 - 0.94 = $8.53). My profit would be $1.08 ($10.55 - $9.47 = $1.08). On a 2.5:1 risk reward ratio-- my preferred ratio-- with a stop-loss of $.94, I would need a profit of $1.88. This is not there, so I would not buy at the current price. However, because the RSI indicator is rising, and that a saucer-shaped formation has developed, still makes the share very tempting, and one that I won't delete from my WATCH book. |

|
| Figure 1: QLT Inc. |
| Graphic provided by: AdvancedGET. |
| Graphic provided by: PF Scan. |
| |
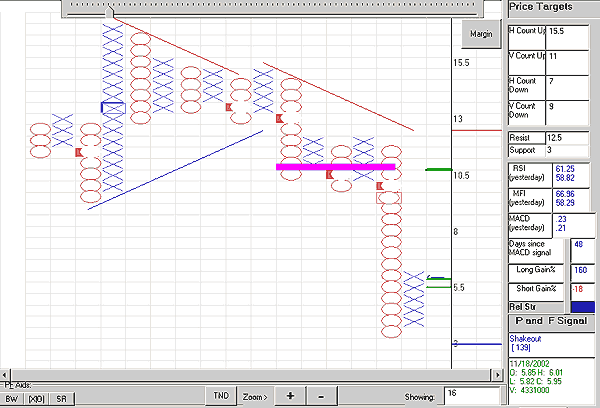
Because of this, I will look at a point and figure chart (below) to see if there is something I am missing. Using the program PF Scan, I have drawn a P&F chart that shows that the share could rise to test a triple top formation at $12. The horizontal target count is $15.5 and a vertical count is only $11, one dollar below the triple top level of $12. Figure 2: Point and Figure chart generated from PF Scan showing a triple top formation for QLT. |
| The maxim, "when in doubt, stay out" comes to mind, and I am in doubt, so I am going to put the share aside. If I am wrong in not buying the share, then I am wrong. I would rather use my efforts to find something that meets all my COMFORT PARAMETERS. |
Has been a technical analyst since 1969, and has worked as a futures and options trader with First Financial Futures in Johannesburg, South Africa.
| Address: | 3256 West 24th Ave |
| Vancouver, BC | |
| Phone # for sales: | 6042634214 |
| E-mail address: | petroosp@gmail.com |
Click here for more information about our publications!
Comments
Date: 11/26/02Rank: 5Comment:
Date: 11/28/02Rank: 4Comment:
Date: 11/28/02Rank: 4Comment: where can I get more info on PF Scan?

Request Information From Our Sponsors
- StockCharts.com, Inc.
- Candle Patterns
- Candlestick Charting Explained
- Intermarket Technical Analysis
- John Murphy on Chart Analysis
- John Murphy's Chart Pattern Recognition
- John Murphy's Market Message
- MurphyExplainsMarketAnalysis-Intermarket Analysis
- MurphyExplainsMarketAnalysis-Visual Analysis
- StockCharts.com
- Technical Analysis of the Financial Markets
- The Visual Investor
- VectorVest, Inc.
- Executive Premier Workshop
- One-Day Options Course
- OptionsPro
- Retirement Income Workshop
- Sure-Fire Trading Systems (VectorVest, Inc.)
- Trading as a Business Workshop
- VectorVest 7 EOD
- VectorVest 7 RealTime/IntraDay
- VectorVest AutoTester
- VectorVest Educational Services
- VectorVest OnLine
- VectorVest Options Analyzer
- VectorVest ProGraphics v6.0
- VectorVest ProTrader 7
- VectorVest RealTime Derby Tool
- VectorVest Simulator
- VectorVest Variator
- VectorVest Watchdog
