HOT TOPICS LIST
- MACD
- Fibonacci
- RSI
- Gann
- ADXR
- Stochastics
- Volume
- Triangles
- Futures
- Cycles
- Volatility
- ZIGZAG
- MESA
- Retracement
- Aroon
INDICATORS LIST
LIST OF TOPICS
PRINT THIS ARTICLE
by Jason K. Hutson
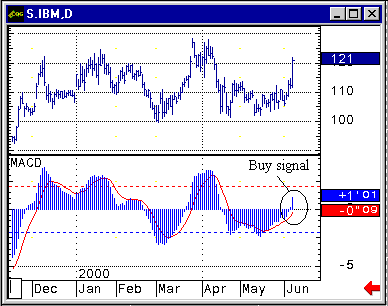
Look at the chart for International Business Machines(IBM) There seems to be a buy signal created by using the MACD crossover.
Position: Buy
Jason K. Hutson
Traders.com Staff Writer. Enjoys trendlines, support and resistance, moving averages, RSI, MACD, ADX, Bollinger bands, parabolic SAR, chart formations, and volume analysis.
PRINT THIS ARTICLE
MACD
Using The Moving Average Convergence/ Divergence (MACD) Indicator
06/12/00 11:13:20 AMby Jason K. Hutson
Look at the chart for International Business Machines(IBM) There seems to be a buy signal created by using the MACD crossover.
Position: Buy
| The moving average convergence/divergence (MACD) is a momentum oscillator developed by Gerald Appel in the early 1970s. The MACD measures the divergence or convergence of a shorter moving average with a longer moving average and is represented in two ways: a line form and a histogram. In this chart the histogram version is displayed. In the line version you will see two lines, the "fast" line which is the difference between the 12- and 26-period exponential moving average (EMA), and the "signal" line which is the EMA of the fast line. The histogram displays the difference between the fast and signal lines and are plotted above or below the zero line. It is the crossovers of the fast and signal lines, movement through the zero line, and divergences that generate the buy and sell signals. |
| A sample code for calculating the MACD is: Calpha12 = 2/(12+1) Calpha26 = 2/(26+1) Calpha9 = 2/(9+1) Clast = last price |

|
| The difference between the 12-period and 26-period exponetial moving averages has turned from a negative number to a positive number. This is shown above in the chart as "buy signal". |
| Graphic provided by: CQG. |
| |
| *12 period exponetial moving average EMA12N = Calpha12*(Clast) + (1-Calpha12)*Clastema12 *26 period exponetial moving average EMA26N = Calpha26*(Clast) + (1-Calpha26)*Clastema26 MACD CDIFFMACD = EMA12N - EMA26N Signal Line EMAMACD = Calpha9*CDIFFMACD + (1-Calpha9)*Clastmacd |
Traders.com Staff Writer. Enjoys trendlines, support and resistance, moving averages, RSI, MACD, ADX, Bollinger bands, parabolic SAR, chart formations, and volume analysis.
| Title: | Industrial Engineer |
| Company: | Technical Analysis, Inc. |
| Address: | 4757 California Ave SW |
| Seattle, WA 98116 | |
| Phone # for sales: | 206 938 0570 |
| Website: | Traders.com |
| E-mail address: | JasonHutson@Traders.com |
Traders' Resource Links | |
| Charting the Stock Market: The Wyckoff Method -- Books | |
| Working-Money.com -- Online Trading Services | |
| Traders.com Advantage -- Online Trading Services | |
| Technical Analysis of Stocks & Commodities -- Publications and Newsletters | |
| Working Money, at Working-Money.com -- Publications and Newsletters | |
| Traders.com Advantage -- Publications and Newsletters | |
| Professional Traders Starter Kit -- Software | |
Click here for more information about our publications!
Comments
Date: / /Rank: 1Comment:
Date: / /Rank: 3Comment:
Date: / /Rank: 3Comment:
Date: / /Rank: 4Comment:

Request Information From Our Sponsors
- StockCharts.com, Inc.
- Candle Patterns
- Candlestick Charting Explained
- Intermarket Technical Analysis
- John Murphy on Chart Analysis
- John Murphy's Chart Pattern Recognition
- John Murphy's Market Message
- MurphyExplainsMarketAnalysis-Intermarket Analysis
- MurphyExplainsMarketAnalysis-Visual Analysis
- StockCharts.com
- Technical Analysis of the Financial Markets
- The Visual Investor
- VectorVest, Inc.
- Executive Premier Workshop
- One-Day Options Course
- OptionsPro
- Retirement Income Workshop
- Sure-Fire Trading Systems (VectorVest, Inc.)
- Trading as a Business Workshop
- VectorVest 7 EOD
- VectorVest 7 RealTime/IntraDay
- VectorVest AutoTester
- VectorVest Educational Services
- VectorVest OnLine
- VectorVest Options Analyzer
- VectorVest ProGraphics v6.0
- VectorVest ProTrader 7
- VectorVest RealTime Derby Tool
- VectorVest Simulator
- VectorVest Variator
- VectorVest Watchdog
