

HOT TOPICS LIST
- MACD
- Fibonacci
- RSI
- Gann
- ADXR
- Stochastics
- Volume
- Triangles
- Futures
- Cycles
- Volatility
- ZIGZAG
- MESA
- Retracement
- Aroon
INDICATORS LIST
LIST OF TOPICS
PRINT THIS ARTICLE
by Koos van der Merwe
Microsoft has been at the top, fallen from that position and is now looking at the top again. Is it a buy?
Position: Sell
Koos van der Merwe
Has been a technical analyst since 1969, and has worked as a futures and options trader with First Financial Futures in Johannesburg, South Africa.
PRINT THIS ARTICLE
GAPS
A Look At Microsoft
12/14/15 04:09:53 PMby Koos van der Merwe
Microsoft has been at the top, fallen from that position and is now looking at the top again. Is it a buy?
Position: Sell
| Microsoft rose to a high of $60.43 by December 1999. From that date, along with the technology bubble that burst, the share price dropped dramatically. We all know that Microsoft was founded by Paul Allen and Bill Gates in 1975. The company developed MS-DOS in the mid-1980's, followed by Microsoft Windows operating system. On January 13th 2000, Bill Gates handed over the CEO position to Steve Ballmer, and on February 4th 2014, Steve Ballmer stepped down as CEO and was succeeded by Satya Nadella. |
|
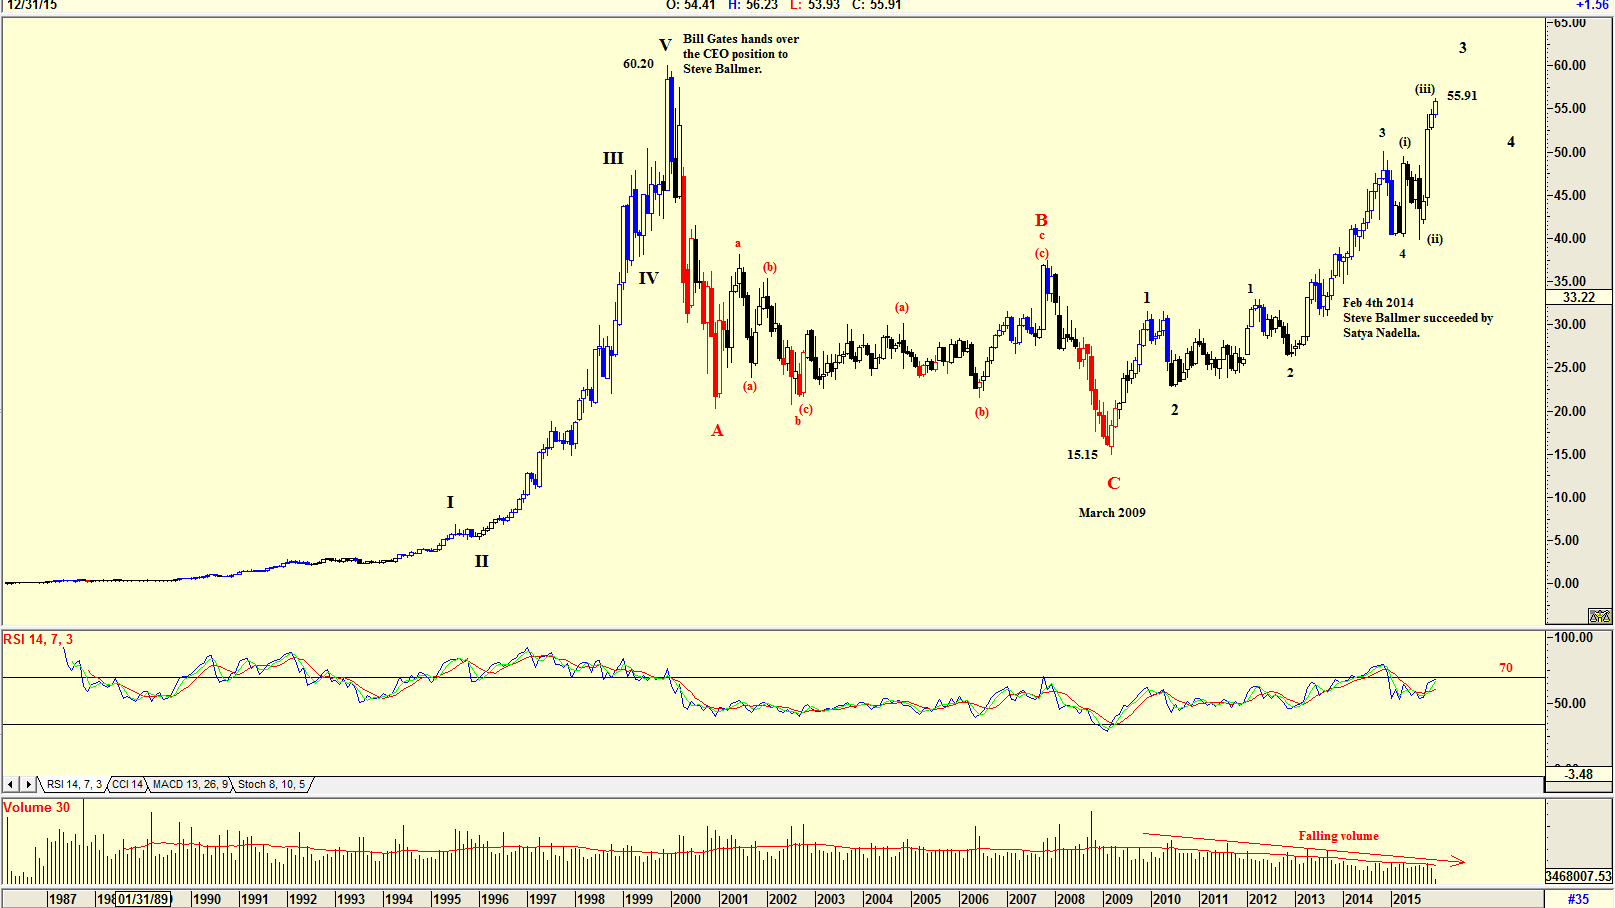
| Figure 1. Monthly chart of MSFT with Elliott wave count. |
| Graphic provided by: AdvancedGET. |
| |
| The chart in Figure 1 is a monthly chart of Microsoft. The chart shows how the share price of Microsoft dropped radically from a high of $60.20 as the technology bubble burst and as Steve Ballmer took over as CEO, and then moved sideways, eventually finding a bottom in March 2009 at $15.15. The share price started to recover as the US economy in general recovered from the mortgage-backed security bubble, and has continued to recover under Satya Nadella, reaching a high of $55.91 by December 2015. The Elliott wave count shown on the chart suggests that the share price could be tracing a wave (iii) of a Wave 3 of a WAVE 1. With the RSI giving a SELL as it broke below the 70 horizontal and with volume falling as the price rose, we can therefore expect a correction to occur at any time. |
|
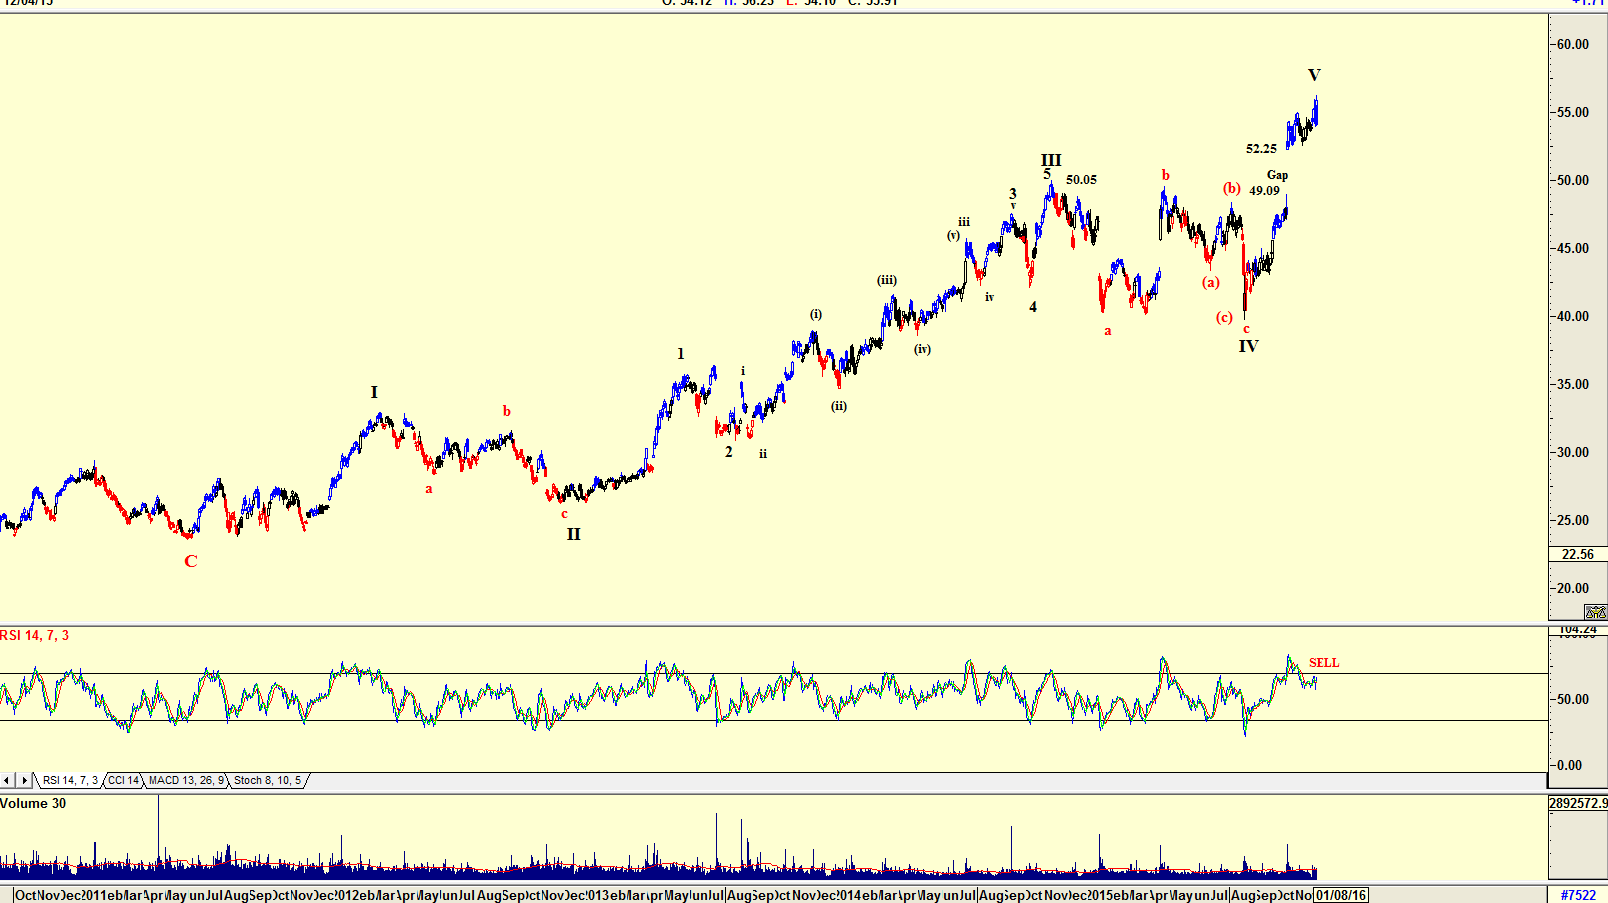
| Figure 2. Daily chart of MSFT showing the gap. |
| Graphic provided by: AdvancedGET. |
| |
| The chart in Figure 2 is a daily chart with an Elliott wave count suggesting that the share price could be reaching a WAVE V high. With the RSI indicator having suggested a sell, and the gap that formed as the share price rose strongly, the share price should now fall to fill the gap with a target of somewhere between $49.09 and $52.25. |
|
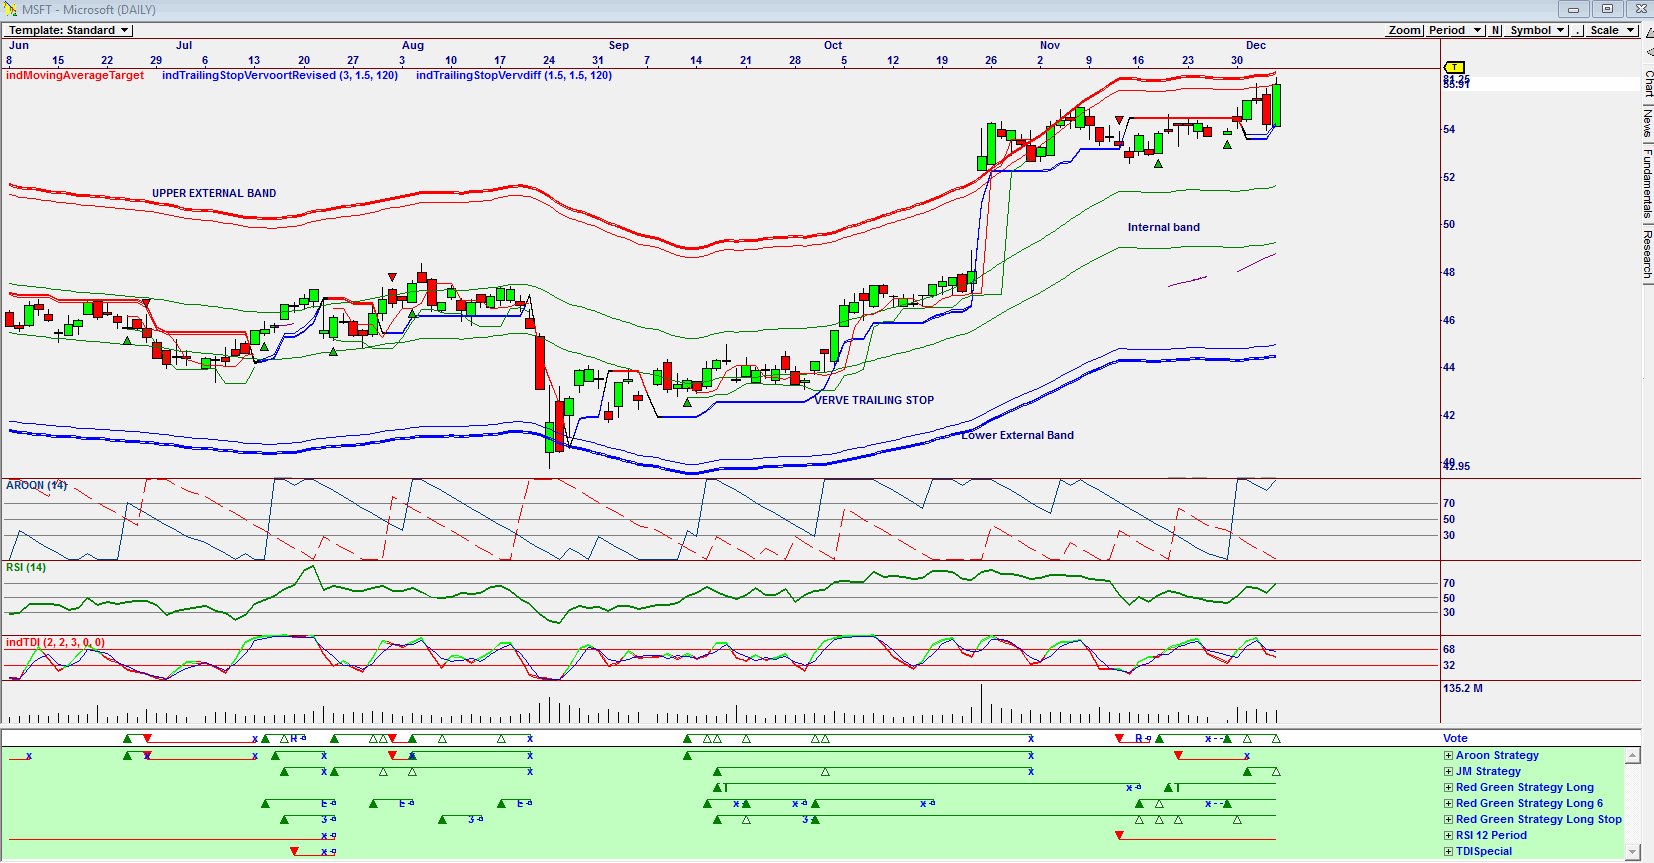
| Figure 3. Omnitrader chart of MSFT with the Vote line positive but price testing the upper external band. |
| Graphic provided by: Omnitrader. |
| |
| The chart in Figure 3 is an Omnitrader chart with the Vote line suggesting that the share price is still a buy. However, with the price reaching the upper external band and the RSI and indTDI indicators trending down, I would not be a buyer of the share at the present price as tempting as it may be. Many fundamental analysts have recommended Microsoft shares as a buy at present levels. Based on technical analysis, however, I would be careful, possibly even being a seller of the shares. To "FILL THE GAP" is a mantra that has always, to my knowledge, succeeded. |
Has been a technical analyst since 1969, and has worked as a futures and options trader with First Financial Futures in Johannesburg, South Africa.
| Address: | 3256 West 24th Ave |
| Vancouver, BC | |
| Phone # for sales: | 6042634214 |
| E-mail address: | petroosp@gmail.com |
Click here for more information about our publications!
PRINT THIS ARTICLE

Request Information From Our Sponsors
- StockCharts.com, Inc.
- Candle Patterns
- Candlestick Charting Explained
- Intermarket Technical Analysis
- John Murphy on Chart Analysis
- John Murphy's Chart Pattern Recognition
- John Murphy's Market Message
- MurphyExplainsMarketAnalysis-Intermarket Analysis
- MurphyExplainsMarketAnalysis-Visual Analysis
- StockCharts.com
- Technical Analysis of the Financial Markets
- The Visual Investor
- VectorVest, Inc.
- Executive Premier Workshop
- One-Day Options Course
- OptionsPro
- Retirement Income Workshop
- Sure-Fire Trading Systems (VectorVest, Inc.)
- Trading as a Business Workshop
- VectorVest 7 EOD
- VectorVest 7 RealTime/IntraDay
- VectorVest AutoTester
- VectorVest Educational Services
- VectorVest OnLine
- VectorVest Options Analyzer
- VectorVest ProGraphics v6.0
- VectorVest ProTrader 7
- VectorVest RealTime Derby Tool
- VectorVest Simulator
- VectorVest Variator
- VectorVest Watchdog