HOT TOPICS LIST
- MACD
- Fibonacci
- RSI
- Gann
- ADXR
- Stochastics
- Volume
- Triangles
- Futures
- Cycles
- Volatility
- ZIGZAG
- MESA
- Retracement
- Aroon
INDICATORS LIST
LIST OF TOPICS
PRINT THIS ARTICLE
by Koos van der Merwe
Yahoo shares fall after CEO Marissa Mayer reveals she is pregnant. Will Facebook shares follow suit with Mark Zuckerberg's pending paternity leave?
Position: Sell
Koos van der Merwe
Has been a technical analyst since 1969, and has worked as a futures and options trader with First Financial Futures in Johannesburg, South Africa.
PRINT THIS ARTICLE
TECHNICAL ANALYSIS
Facebook's Pregnancy Test
12/08/15 03:51:27 PMby Koos van der Merwe
Yahoo shares fall after CEO Marissa Mayer reveals she is pregnant. Will Facebook shares follow suit with Mark Zuckerberg's pending paternity leave?
Position: Sell
| Marissa Mayer only took two weeks maternity leave for her first child, and is due to give birth again in December 2015 to twins. Although she has given new mothers 16 weeks maternity leave, she herself plans a rapid return, planning to take just two week's maternity leave. The stock market reacted badly to the announcement with shares of Yahoo falling by more than two percent. On Tuesday November 24th, Mark Zuckerberg announced that he would be taking a two month paternity leave when his daughter is born. With Yahoo shares falling after Marissa Mayer's announcement, does this mean that the shares of Facebook will fall? |

|
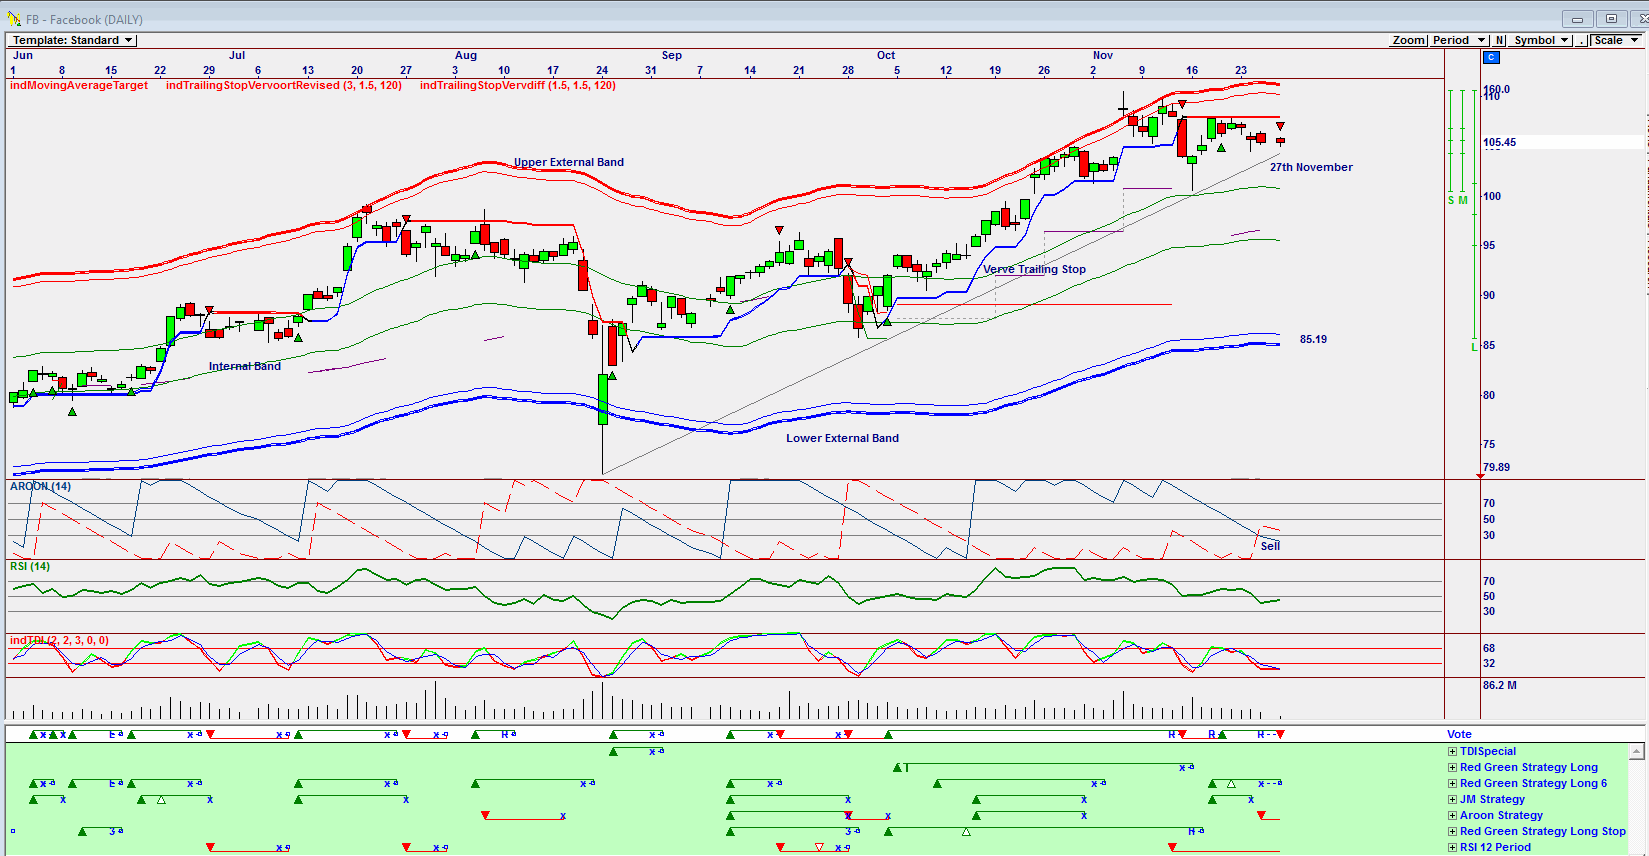
| Figure 1. Daily Omnitrader chart showing sell signal. |
| Graphic provided by: Omnitrader. |
| |
| The chart in Figure 1 is a daily Omnitrader chart of Facebook showing a sell signal given on the 27th November based on the Aroon and RSI 12 Period strategies shown in green below the Vote line. Does this mean that Facebook's shares are going to follow the example made by Yahoo's share price after Marissa Mayer's announcement? If so, the share price could possibly fall to the lower external band of $85.19. Do note, however, that the indTDI indicator is at oversold levels but the RSI 14 indicator is still trending down. The Aroon 14 indicator, however, has given a sell signal. |

|
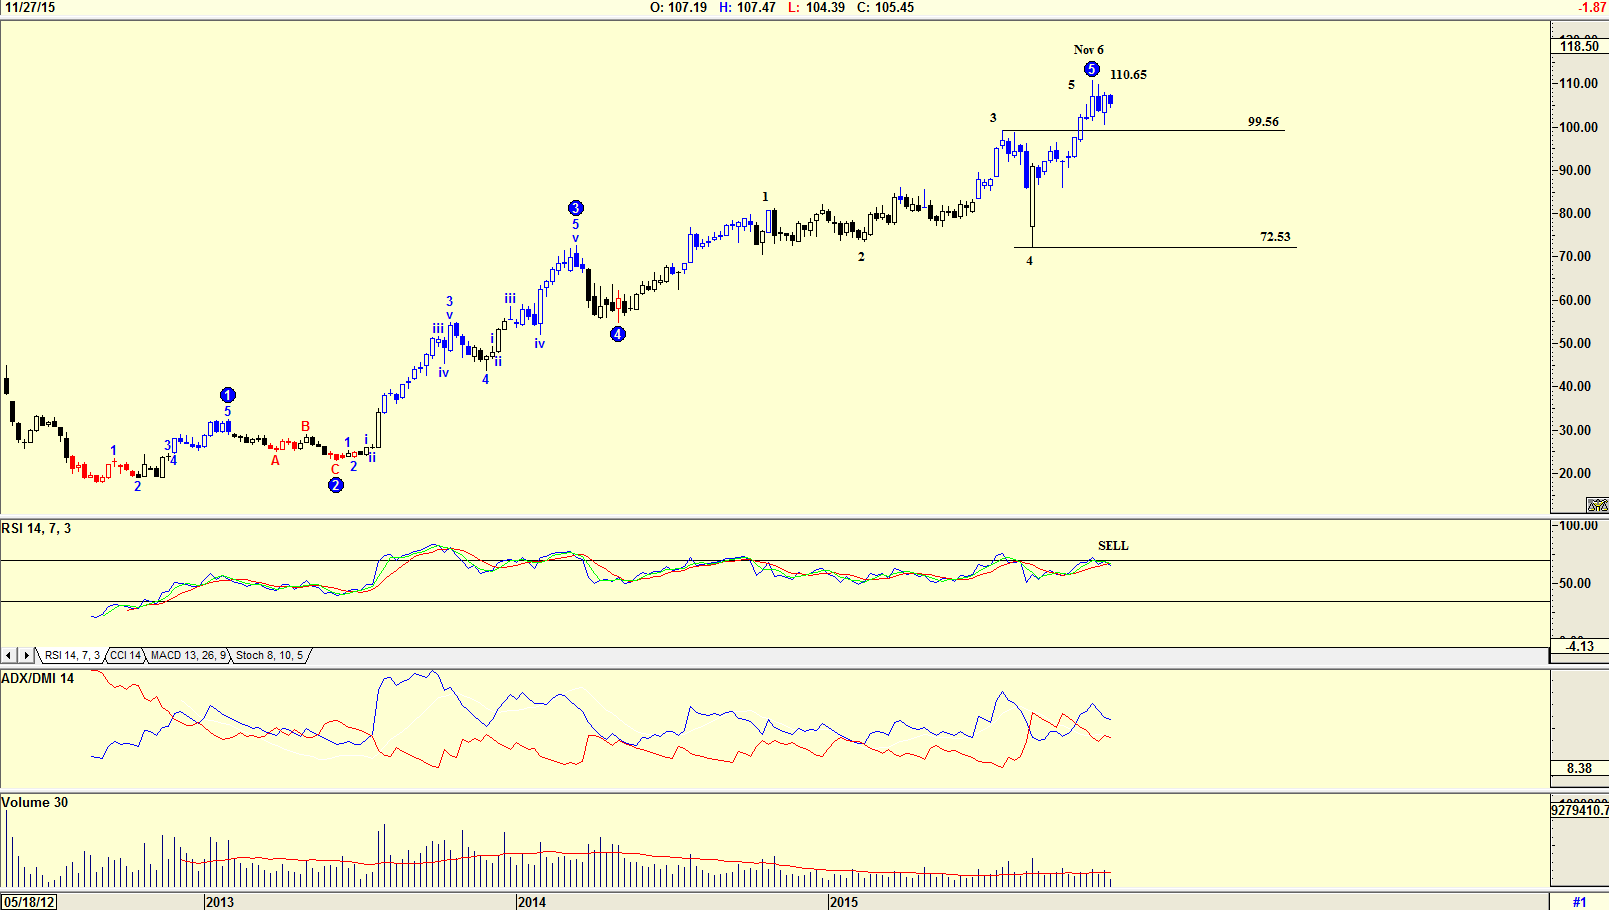
| Figure 2. Weekly chart with Elliott wave count. |
| Graphic provided by: AdvancedGET. |
| |
| The chart in Figure 2 is a weekly chart with an Elliott wave count suggesting that the share price has topped out in a WAVE 5 at $110.65 on the week ending November 6th. The share price could now fall in an ABC correction to somewhere between $99.56 and $72.53, the 4th wave of lesser degree. Note that the RSI 14 indicator is at overbought levels and has given a SELL signal, but the ADX/DMI 14 indicator has not. |

|
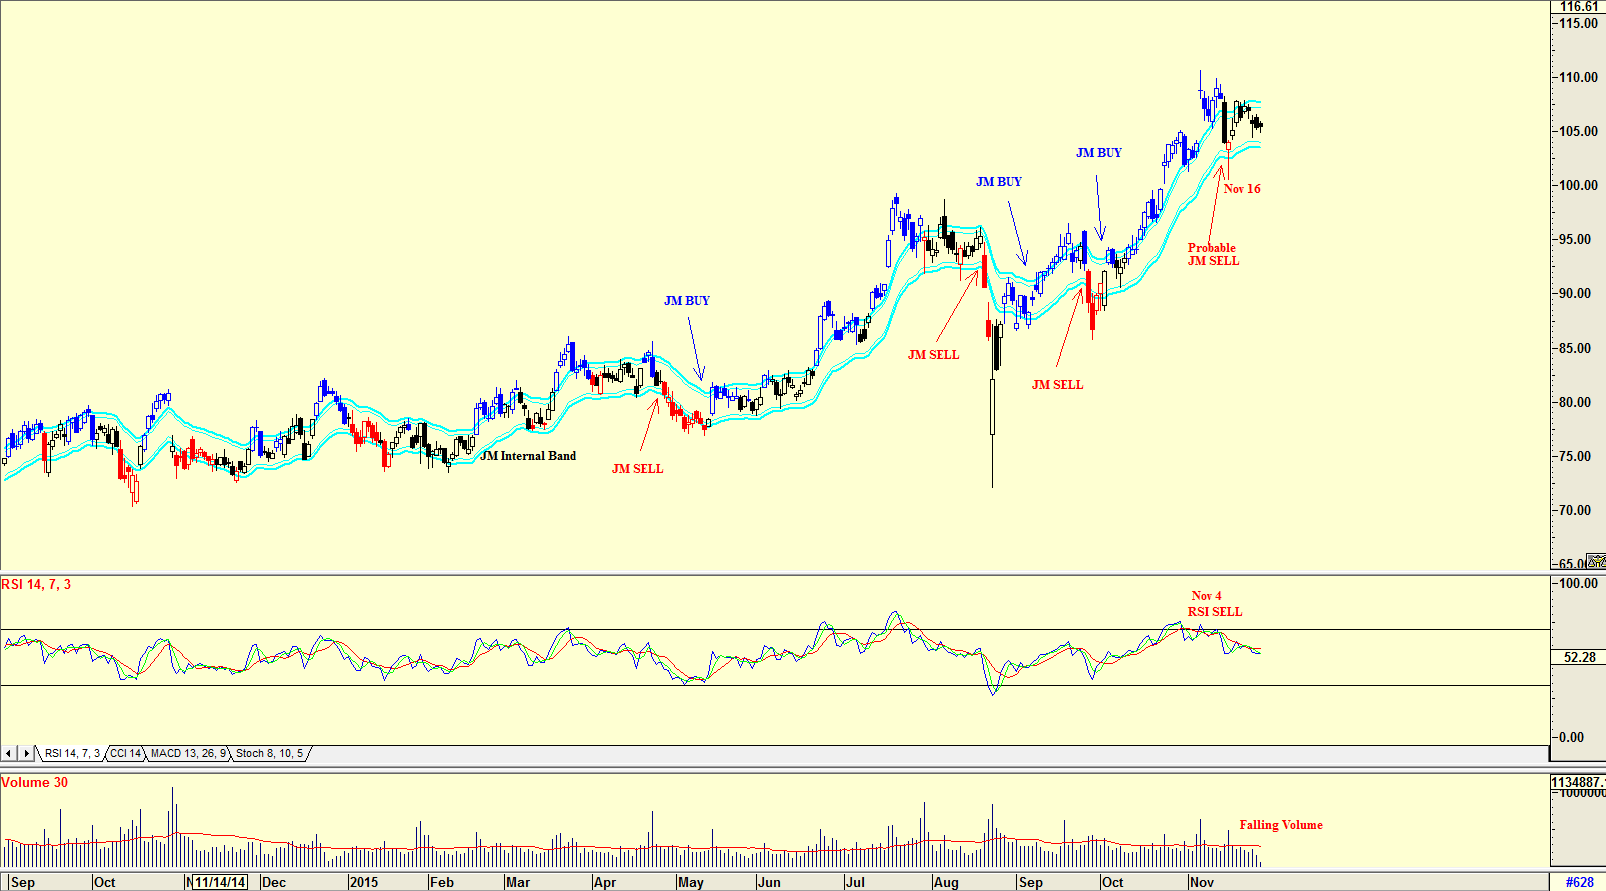
| Figure 3. Daily chart with JM Internal Band. |
| Graphic provided by: AdvancedGET. |
| |
| The chart in Figure 3 is a daily chart with a JM Internal Band that suggested a possible sell signal on November 16th. The RSI 14 indicator is trending down after giving a sell signal on November 4th. The falling volume, however, does suggest that the fall in price could reverse because a falling volume as a share price falls suggests strength, not weakness. The share price of Facebook looks weak and I would not be a buyer, but rather a seller of the shares. Whether this is because of Mark Zuckerberg's paternity leave is anyone's guess. But whatever the reason, it cannot be ignored. |
Has been a technical analyst since 1969, and has worked as a futures and options trader with First Financial Futures in Johannesburg, South Africa.
| Address: | 3256 West 24th Ave |
| Vancouver, BC | |
| Phone # for sales: | 6042634214 |
| E-mail address: | petroosp@gmail.com |
Click here for more information about our publications!
PRINT THIS ARTICLE

Request Information From Our Sponsors
- StockCharts.com, Inc.
- Candle Patterns
- Candlestick Charting Explained
- Intermarket Technical Analysis
- John Murphy on Chart Analysis
- John Murphy's Chart Pattern Recognition
- John Murphy's Market Message
- MurphyExplainsMarketAnalysis-Intermarket Analysis
- MurphyExplainsMarketAnalysis-Visual Analysis
- StockCharts.com
- Technical Analysis of the Financial Markets
- The Visual Investor
- VectorVest, Inc.
- Executive Premier Workshop
- One-Day Options Course
- OptionsPro
- Retirement Income Workshop
- Sure-Fire Trading Systems (VectorVest, Inc.)
- Trading as a Business Workshop
- VectorVest 7 EOD
- VectorVest 7 RealTime/IntraDay
- VectorVest AutoTester
- VectorVest Educational Services
- VectorVest OnLine
- VectorVest Options Analyzer
- VectorVest ProGraphics v6.0
- VectorVest ProTrader 7
- VectorVest RealTime Derby Tool
- VectorVest Simulator
- VectorVest Variator
- VectorVest Watchdog
