HOT TOPICS LIST
- MACD
- Fibonacci
- RSI
- Gann
- ADXR
- Stochastics
- Volume
- Triangles
- Futures
- Cycles
- Volatility
- ZIGZAG
- MESA
- Retracement
- Aroon
INDICATORS LIST
LIST OF TOPICS
PRINT THIS ARTICLE
by Koos van der Merwe
With the oil price falling so badly over the past year, is it time to start looking at energy stocks as a possible buy?
Position: Accumulate
Koos van der Merwe
Has been a technical analyst since 1969, and has worked as a futures and options trader with First Financial Futures in Johannesburg, South Africa.
PRINT THIS ARTICLE
TECHNICAL ANALYSIS
Husky Energy
12/02/15 10:27:59 AMby Koos van der Merwe
With the oil price falling so badly over the past year, is it time to start looking at energy stocks as a possible buy?
Position: Accumulate
| The price of oil, as we all know, has fallen strongly over the past year. Stocks that are related to the oil price have fallen heavily as well, but, as we all know, sometime in the future, the oil price will bottom and start rising taking energy stocks with it. Is it time to be a 'bottom gambler' and start looking at energy stocks as a buy? If so, Husky Energy on the Canadian market is a stock one can keep an eye on. |

|
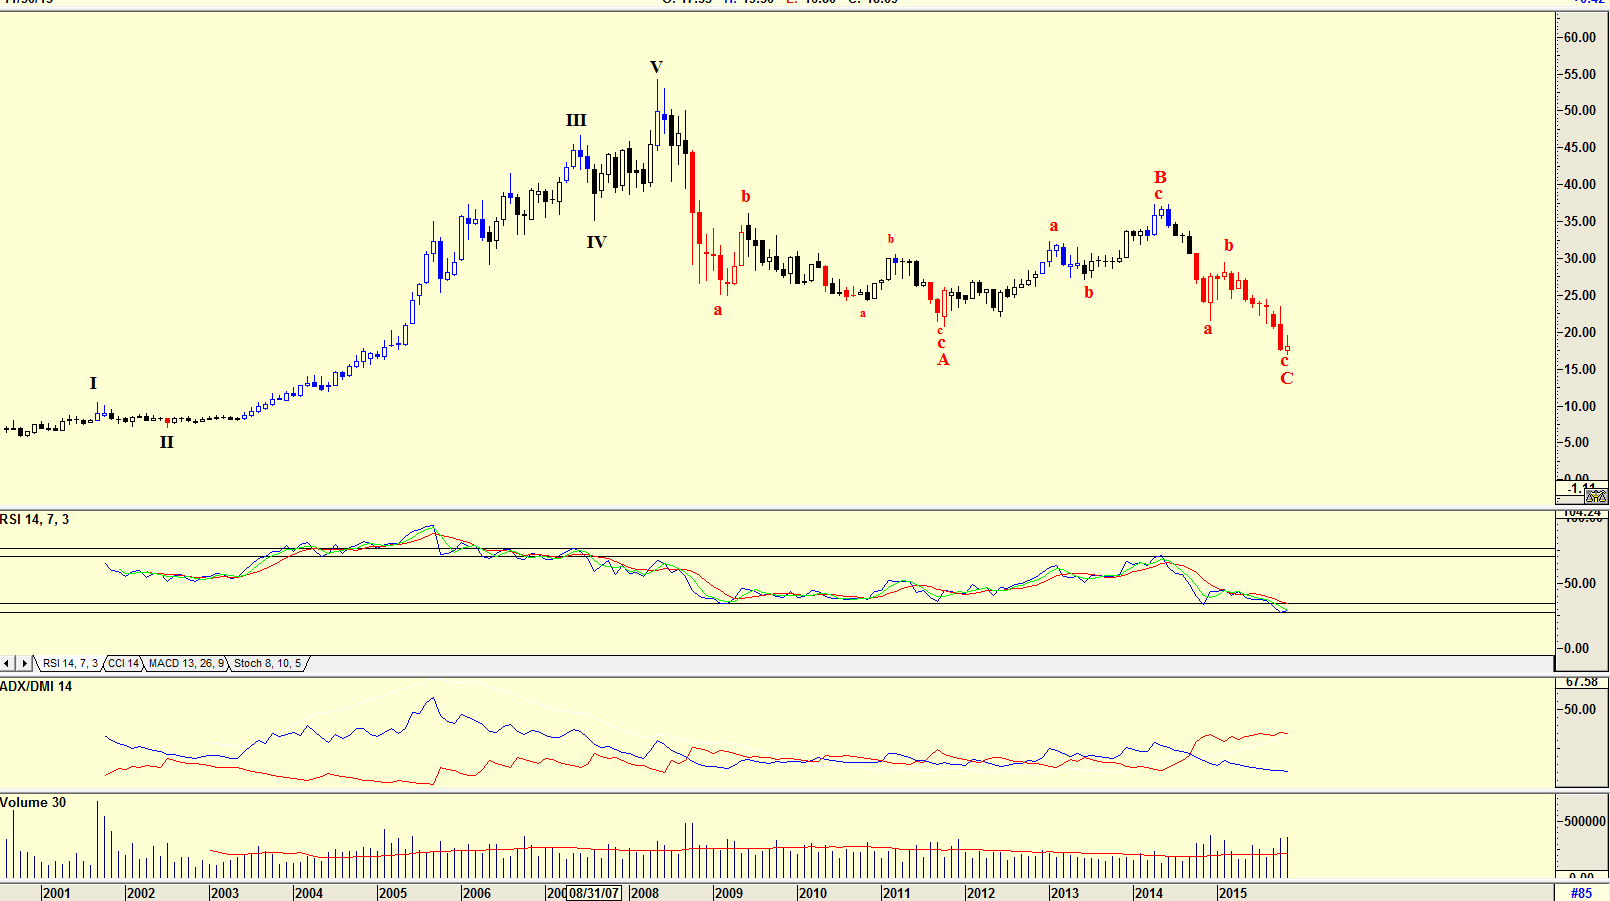
| Figure 1. Husky Energy. Monthly chart with Elliott wave count. |
| Graphic provided by: AdvancedGET. |
| |
| The chart in Figure 1 is a monthly chart of Husky Energy with an Elliott wave count suggesting that the chart could be bottoming in a major WAVE C. The chart shows that WAVE C has fallen in an abc correction. A WAVE C should in fact fall in a 1-2-3-4-5 correction, but the current count could be true simply because the RSI indicator is at oversold levels. Volume has risen as the share price fell, suggesting further weakness, so uncertainty exists. |

|
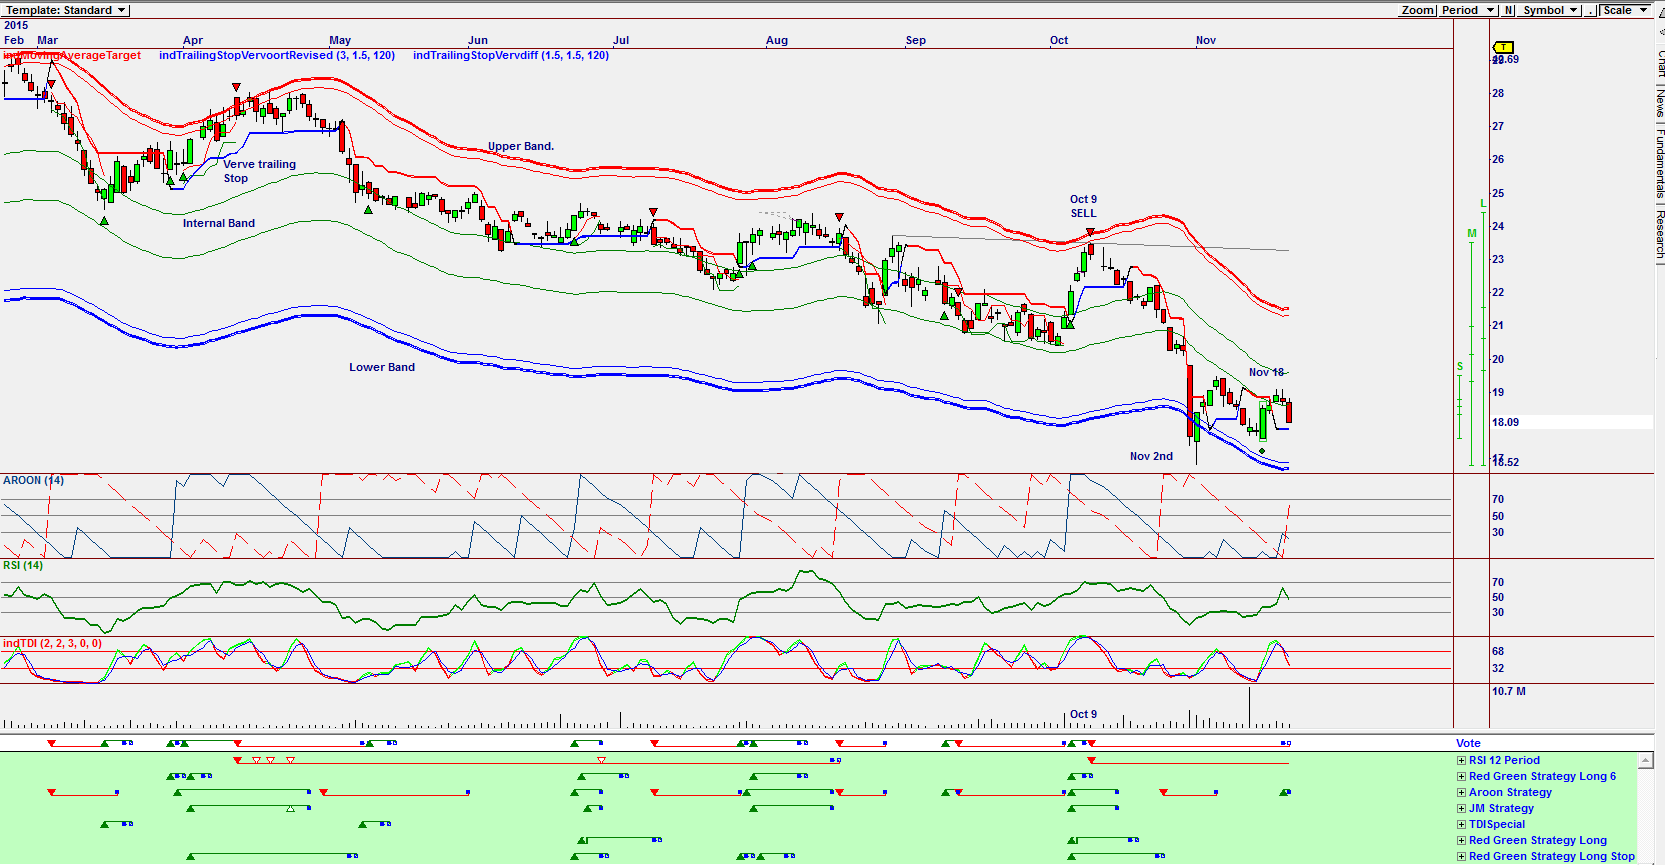
| Figure 2. Daily Omnitrader chart for Husky Energy. |
| Graphic provided by: Omnitrader. |
| |
| The chart in Figure 2 is a daily Omnitrader chart with a Vote line showing a stop on a sell signal given on October 9th triggered by the RSI 12 Period strategy shown in green below the Vote line. Note that the share price tested the Upper Band suggesting that there would possibly be weakness ahead. The share price fell and tested the lower band on November 2nd, bounced up and found resistance on the lower internal band. However, both the RSI indicator and the indTDI gave buys on November 3rd. The AROON indicator gave a buy in November 18th followed by a sell on November 19th. One should, therefore, wait for the share price to retest the lows before the indicators will suggest a buy. The TDI indicator and the AROON indicator both suggest weakness although the RSI is still trending up. |

|
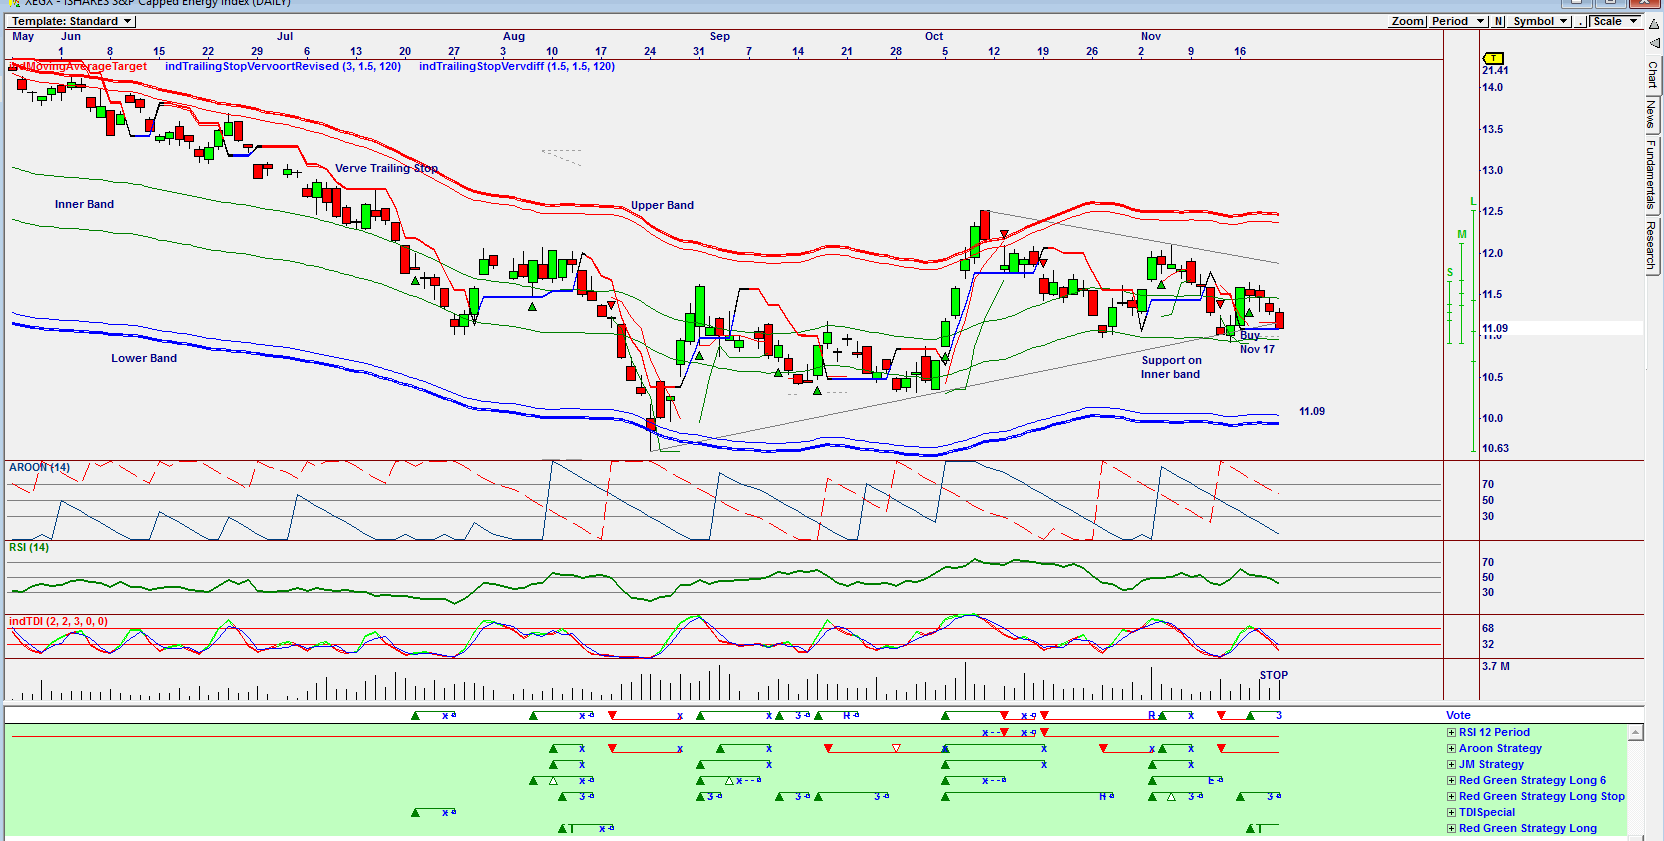
| Figure 3. Daily chart of i-Unit Energy. |
| Graphic provided by: Omnitrader. |
| |
| Another energy share quoted on the Toronto Stock Exchange to keep an eye on is the ETF i-Unit Energy Index (XEG-T). The chart in Figure 3 is a daily Omnitrader chart with all three indicators suggesting further weakness ahead. Do note, however, that the price appears to have found support on the inner band. The Vote line has also give a stop signal on the buy signal given on November 17th. There is a strong possibility that the price of the ETF could fall further to test the lower band at $11.09. With the fall of the oil price, energy shares have fallen as well, but a bottom could form in the not so distant future. Making a list of energy stocks to keep an eye on and buy as a bottom is developing, is a good idea. |
Has been a technical analyst since 1969, and has worked as a futures and options trader with First Financial Futures in Johannesburg, South Africa.
| Address: | 3256 West 24th Ave |
| Vancouver, BC | |
| Phone # for sales: | 6042634214 |
| E-mail address: | petroosp@gmail.com |
Click here for more information about our publications!
Comments
Date: 12/05/15Rank: 5Comment:

Request Information From Our Sponsors
- StockCharts.com, Inc.
- Candle Patterns
- Candlestick Charting Explained
- Intermarket Technical Analysis
- John Murphy on Chart Analysis
- John Murphy's Chart Pattern Recognition
- John Murphy's Market Message
- MurphyExplainsMarketAnalysis-Intermarket Analysis
- MurphyExplainsMarketAnalysis-Visual Analysis
- StockCharts.com
- Technical Analysis of the Financial Markets
- The Visual Investor
- VectorVest, Inc.
- Executive Premier Workshop
- One-Day Options Course
- OptionsPro
- Retirement Income Workshop
- Sure-Fire Trading Systems (VectorVest, Inc.)
- Trading as a Business Workshop
- VectorVest 7 EOD
- VectorVest 7 RealTime/IntraDay
- VectorVest AutoTester
- VectorVest Educational Services
- VectorVest OnLine
- VectorVest Options Analyzer
- VectorVest ProGraphics v6.0
- VectorVest ProTrader 7
- VectorVest RealTime Derby Tool
- VectorVest Simulator
- VectorVest Variator
- VectorVest Watchdog
