

HOT TOPICS LIST
- MACD
- Fibonacci
- RSI
- Gann
- ADXR
- Stochastics
- Volume
- Triangles
- Futures
- Cycles
- Volatility
- ZIGZAG
- MESA
- Retracement
- Aroon
INDICATORS LIST
LIST OF TOPICS
PRINT THIS ARTICLE
by Matt Blackman
Market pundit and author Vikram Mansharamani first introduced auction house Sotheby's as an advance market indicator. Here's what that indicator is saying now.
Position: N/A
Matt Blackman
Matt Blackman is a full-time technical and financial writer and trader. He produces corporate and financial newsletters, and assists clients in getting published in the mainstream media. He is the host of TradeSystemGuru.com. Matt has earned the Chartered Market Technician (CMT) designation. Find out what stocks and futures Matt is watching on Twitter at www.twitter.com/RatioTrade
PRINT THIS ARTICLE
DOUBLE TOPS
Is Sotheby's BID-ding The Markets Lower?
11/23/15 05:02:19 PMby Matt Blackman
Market pundit and author Vikram Mansharamani first introduced auction house Sotheby's as an advance market indicator. Here's what that indicator is saying now.
Position: N/A
| As traders, it is our job to look out for relationships that help us making better trading decisions. When an indicator moves with, or ideally, ahead of an index or stock, it shows correlation. The stronger this correlation, the better it is a trading tool. In his 2011 book Boom Bustology - Spotting Financial Bubbles Before They Burst, Vikram introduced the correlation between the art market, specifically art auctions as prognosticators of animal spirits in markets and how art markets show when investors are getting over-exuberant, and stocks. And one of the best stocks to show this relationship is auction house Sotheby's (BID). |
|
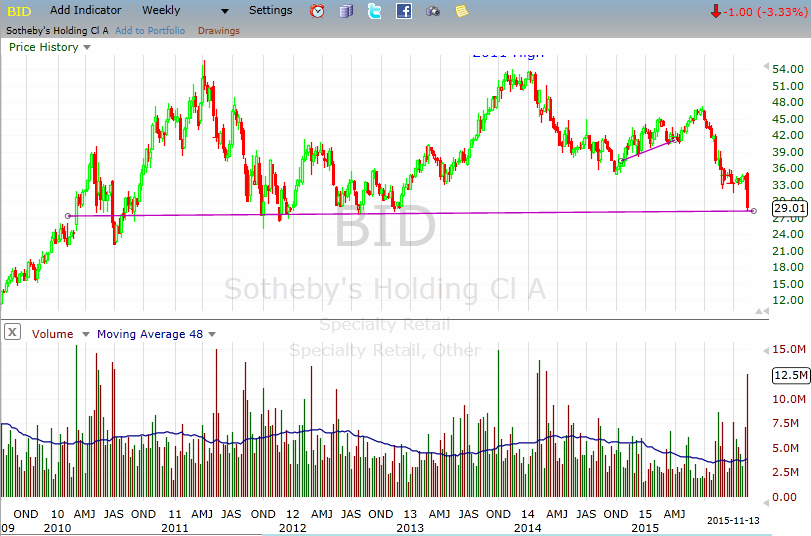
| Figure 1 � Weekly chart showing the very large double top pattern on Sotheby�s stock (BID) with neckline support again being threatened in mid-November 2015. |
| Graphic provided by: Freestockcharts.com. |
| |
| In his latest newsletter titled "Tick, Tick, Tick", Mansharamani outlined a number of relationships that he is again seeing to cause him concern for the larger market. The letter begins with this ominous warning. "The world feels more precarious to me today than it has in a long time; it feels like a ticking time bomb. Perhaps it's just me, but everywhere I look, I see significant risks on the economic and political landscape. These thoughts are based on personal experiences over the past three months." And although his personal experiences are more anecdotal than scientific, there is technical method in his observations, as we see in Figures 1 and 2. |
|
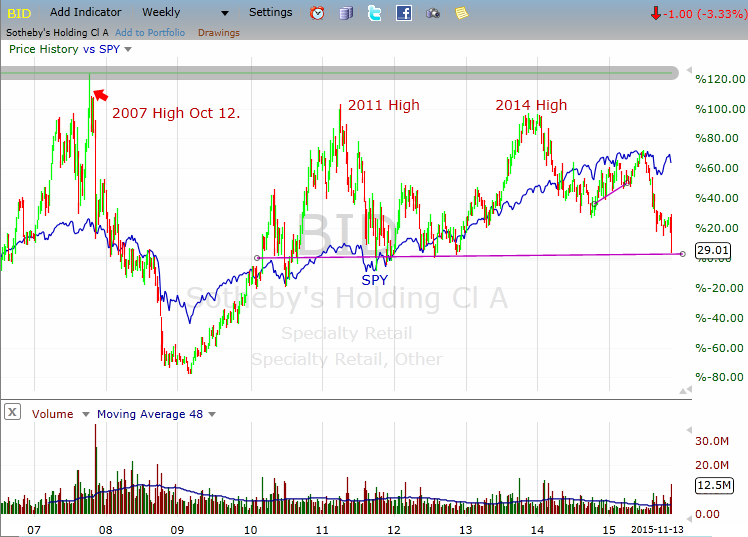
| Figure 2 � Longer-term weekly chart showing the relationship between BID and the S&P500 ETF (SPY). Note the correlation, albeit far from perfect, between the two. |
| Graphic provided by: Freestockcharts.com. |
| |
| Note that BID peaked ahead of the S&P 500 ETF (SPY) warning of the downturn in 2007. The same thing happened in 2011 but the downturn was more muted. However, when BID next peaked in 2014, stocks hardly took notice. But as we see, BID has been trending lower ever since in what could be a longer-term negative divergence with SPY. Whether or not the signal proves prognostic for SPY this time around, a break below the purple neckline on BID would be a powerful sell signal for the stock and probably shouldn't be ignored as yet another sign of market weakness. |
| Suggested Reading; Mansharamani, Vikram - [November 15, 2015] "Tick, Tick, Tick" Mansharamani, Vikram - [2011] Boom, Bustology - Spotting Financial Bubbles Before They Burst, John Wiley & Sons |
Matt Blackman is a full-time technical and financial writer and trader. He produces corporate and financial newsletters, and assists clients in getting published in the mainstream media. He is the host of TradeSystemGuru.com. Matt has earned the Chartered Market Technician (CMT) designation. Find out what stocks and futures Matt is watching on Twitter at www.twitter.com/RatioTrade
| Company: | TradeSystemGuru.com |
| Address: | Box 2589 |
| Garibaldi Highlands, BC Canada | |
| Phone # for sales: | 604-898-9069 |
| Fax: | 604-898-9069 |
| Website: | www.tradesystemguru.com |
| E-mail address: | indextradermb@gmail.com |
Traders' Resource Links | |
| TradeSystemGuru.com has not added any product or service information to TRADERS' RESOURCE. | |
Click here for more information about our publications!
Comments

Request Information From Our Sponsors
- StockCharts.com, Inc.
- Candle Patterns
- Candlestick Charting Explained
- Intermarket Technical Analysis
- John Murphy on Chart Analysis
- John Murphy's Chart Pattern Recognition
- John Murphy's Market Message
- MurphyExplainsMarketAnalysis-Intermarket Analysis
- MurphyExplainsMarketAnalysis-Visual Analysis
- StockCharts.com
- Technical Analysis of the Financial Markets
- The Visual Investor
- VectorVest, Inc.
- Executive Premier Workshop
- One-Day Options Course
- OptionsPro
- Retirement Income Workshop
- Sure-Fire Trading Systems (VectorVest, Inc.)
- Trading as a Business Workshop
- VectorVest 7 EOD
- VectorVest 7 RealTime/IntraDay
- VectorVest AutoTester
- VectorVest Educational Services
- VectorVest OnLine
- VectorVest Options Analyzer
- VectorVest ProGraphics v6.0
- VectorVest ProTrader 7
- VectorVest RealTime Derby Tool
- VectorVest Simulator
- VectorVest Variator
- VectorVest Watchdog