HOT TOPICS LIST
- MACD
- Fibonacci
- RSI
- Gann
- ADXR
- Stochastics
- Volume
- Triangles
- Futures
- Cycles
- Volatility
- ZIGZAG
- MESA
- Retracement
- Aroon
INDICATORS LIST
LIST OF TOPICS
PRINT THIS ARTICLE
by Koos van der Merwe
Can Berkshire Hathaway shares be used as a reliable indicator?
Position: Accumulate
Koos van der Merwe
Has been a technical analyst since 1969, and has worked as a futures and options trader with First Financial Futures in Johannesburg, South Africa.
PRINT THIS ARTICLE
ELLIOTT WAVE
Berkshire Hathaway
11/18/15 03:27:22 PMby Koos van der Merwe
Can Berkshire Hathaway shares be used as a reliable indicator?
Position: Accumulate
| We all know about Warren Buffet's success in the stock market. The firm primarily engages in the insurance and reinsurance of property and casualty risks business. Both shares of Berkshire Hathaway, A and B, have fallen this year, but as Warren Buffett once said "You only have to do a very few things right in your life so long as you don't do too many things wrong." Incidentally he also said, "The most important thing to do if you find yourself in a hole is to stop digging." So, knowing that the company is in the hands of a man with a reputation as solid as a rock; a man that knows when to "stop digging," can you use the chart of Berkshire Hathaway for guidance? |

|
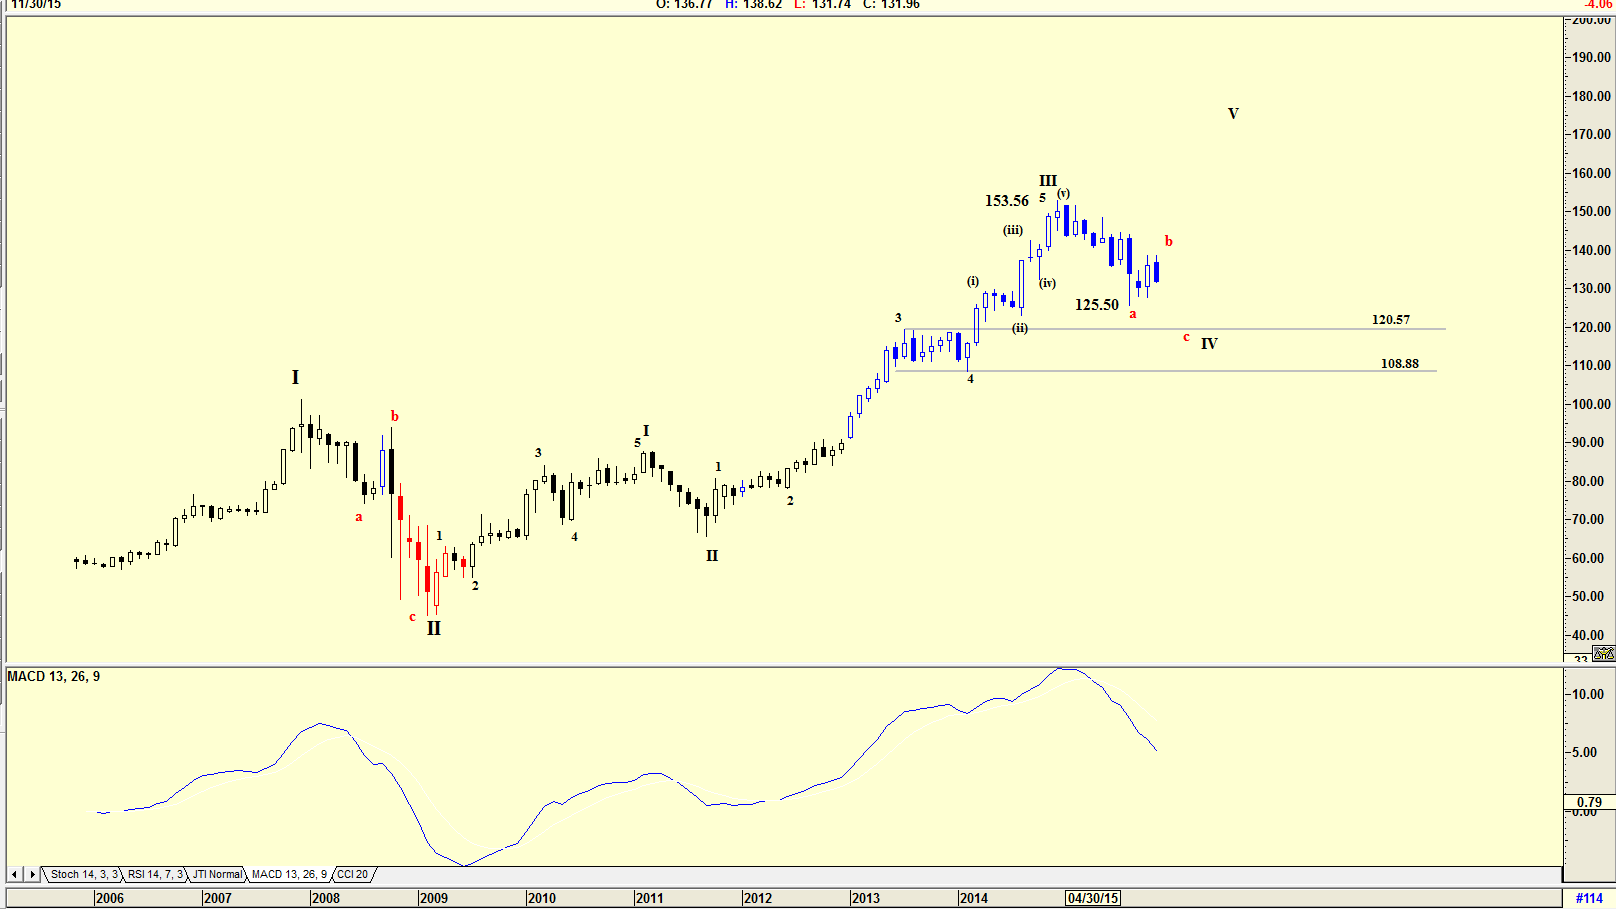
| Figure 1. Monthly chart with Elliott wave count. |
| Graphic provided by: AdvancedGET. |
| |
| The chart in Figure 1 is a monthly chart of Berkshire Hathaway B shares with an Elliott wave count suggesting that the share price could still be in a WAVE IV correction. The correction should be to the 4th wave of lesser degree, that is somewhere between $108.88 and $120 57. This is confirmed by the MACD indicator which is still suggesting weakness. |

|
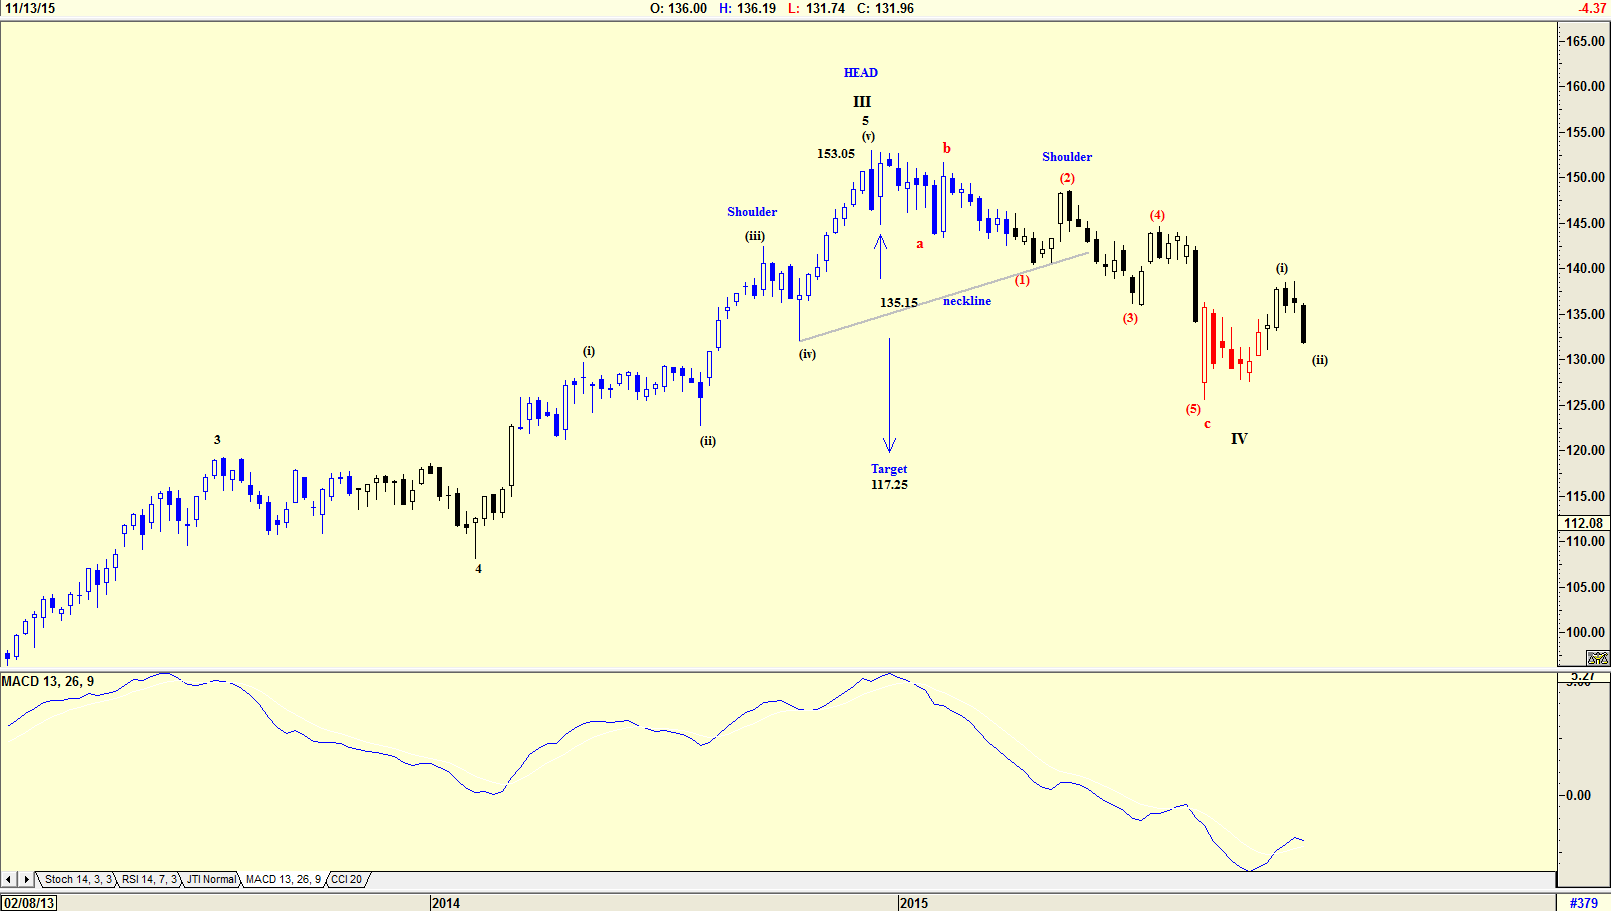
| Figure 2. Weekly chart showing a head and shoulder formation. |
| Graphic provided by: AdvancedGET. |
| |
| The weekly chart in Figure 2 is suggesting that WAVE IV could be complete. This is confirmed by the MACD indicator which has suggested a buy signal. The Elliott wave count shows that wave (ii) of WAVE V could be complete, but this will only be confirmed when the price starts rising, nevertheless, the wave count should be watched closely as the price could fall further. The head and shoulders pattern on the chart is suggesting that the price could fall further to $117.25 (153.05-135.15=17.90. 135.15-17.90=117.25). |

|
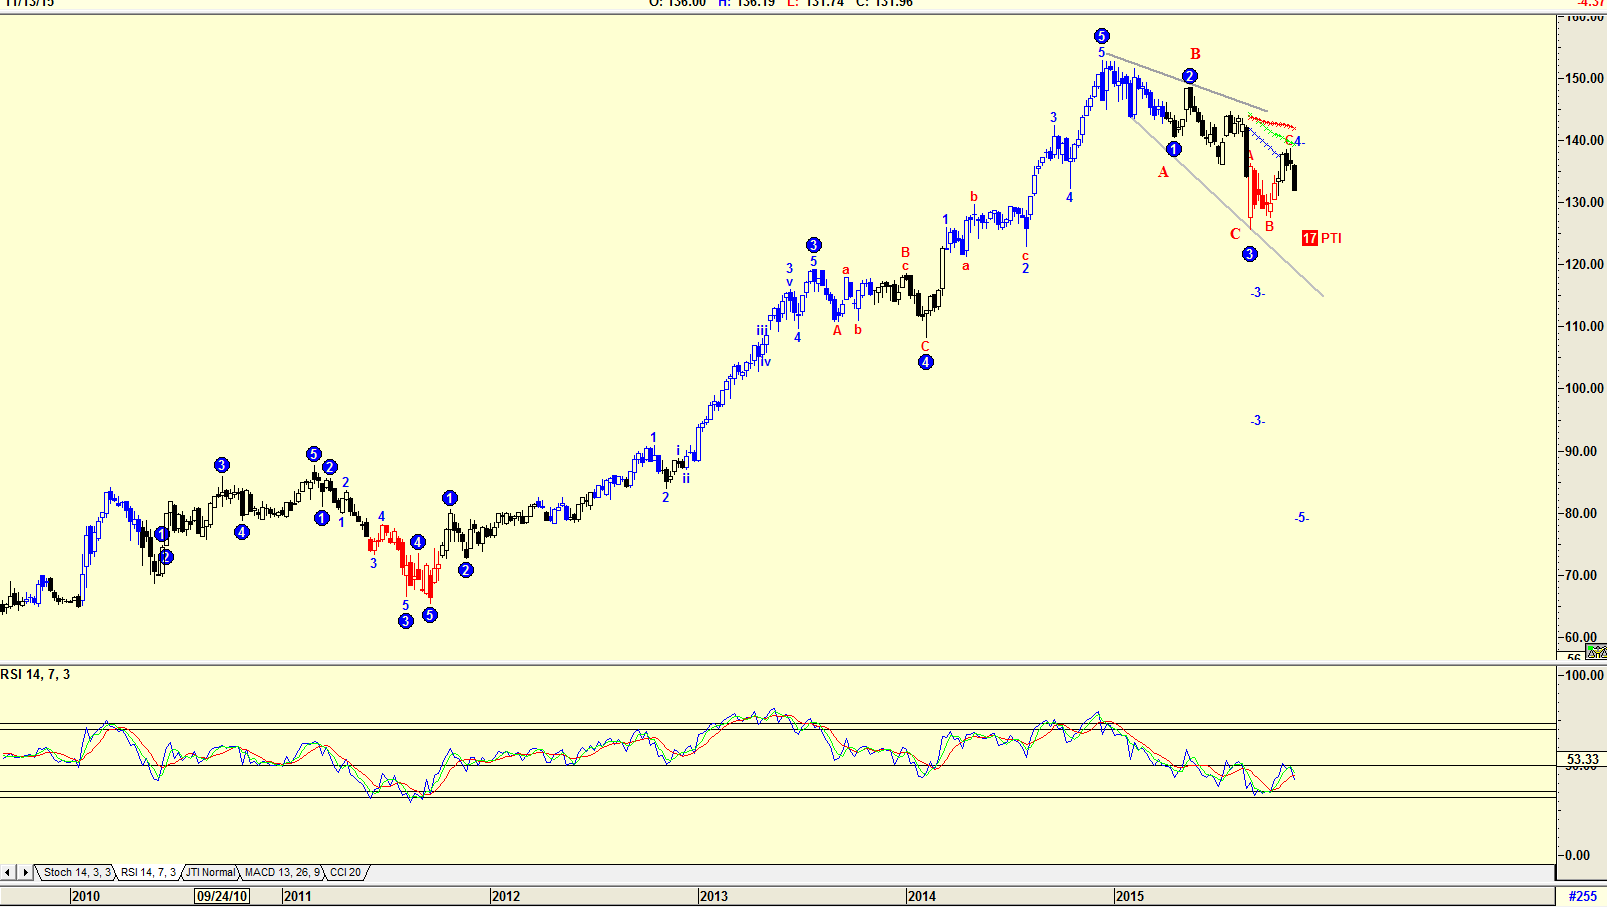
| Figure 3. Daily chart showing the RSI indicator suggesting a buy. |
| Graphic provided by: AdvancedGET. |
| |
| Finally, the daily chart in Figure 3 is a daily chart with an Elliott wave count of the Advanced GET program. The PTI (Probability Index) of 17 suggests that a further fall in price is unlikely, and the RSI indicator is also suggesting strength. Can the share price of Berkshire Hathaway be use as a guideline to where the market is headed? I believe it can. It is presently suggesting that the market will start rising, but in a final WAVE V. |
Has been a technical analyst since 1969, and has worked as a futures and options trader with First Financial Futures in Johannesburg, South Africa.
| Address: | 3256 West 24th Ave |
| Vancouver, BC | |
| Phone # for sales: | 6042634214 |
| E-mail address: | petroosp@gmail.com |
Click here for more information about our publications!
PRINT THIS ARTICLE

Request Information From Our Sponsors
- StockCharts.com, Inc.
- Candle Patterns
- Candlestick Charting Explained
- Intermarket Technical Analysis
- John Murphy on Chart Analysis
- John Murphy's Chart Pattern Recognition
- John Murphy's Market Message
- MurphyExplainsMarketAnalysis-Intermarket Analysis
- MurphyExplainsMarketAnalysis-Visual Analysis
- StockCharts.com
- Technical Analysis of the Financial Markets
- The Visual Investor
- VectorVest, Inc.
- Executive Premier Workshop
- One-Day Options Course
- OptionsPro
- Retirement Income Workshop
- Sure-Fire Trading Systems (VectorVest, Inc.)
- Trading as a Business Workshop
- VectorVest 7 EOD
- VectorVest 7 RealTime/IntraDay
- VectorVest AutoTester
- VectorVest Educational Services
- VectorVest OnLine
- VectorVest Options Analyzer
- VectorVest ProGraphics v6.0
- VectorVest ProTrader 7
- VectorVest RealTime Derby Tool
- VectorVest Simulator
- VectorVest Variator
- VectorVest Watchdog
