HOT TOPICS LIST
- MACD
- Fibonacci
- RSI
- Gann
- ADXR
- Stochastics
- Volume
- Triangles
- Futures
- Cycles
- Volatility
- ZIGZAG
- MESA
- Retracement
- Aroon
INDICATORS LIST
LIST OF TOPICS
PRINT THIS ARTICLE
by Koos van der Merwe
When CEO's announce that they are leaving a company, do you sell the share?
Position: Accumulate
Koos van der Merwe
Has been a technical analyst since 1969, and has worked as a futures and options trader with First Financial Futures in Johannesburg, South Africa.
PRINT THIS ARTICLE
ELLIOTT WAVE
The Brain Drain At Yahoo!
10/30/15 04:04:47 PMby Koos van der Merwe
When CEO's announce that they are leaving a company, do you sell the share?
Position: Accumulate
| Three years ago, Marissa Mayer took over as the new chief executive officer of Yahoo! She was only 37 years old, and as a young woman, was defying the stereotypes by running a technology company. A few days after the appointment, she announced that she was pregnant. Now, three years later, she has once again announced that she is pregnant, and will only take two weeks maternity leave. Ms. Mayer is under no obligation to shareholders to defend her truncated maternity leave, or to explain who will care for her children. With women today more and more becoming involved in the financial world, her decisions set an example other women in business will follow. However, former Yahoo! Chief Development Officer, Jacqueline Reses, and the SVP of Marketing Partnerships, Lisa Licht, are among a string of high-level executives who left Yahoo! this year. Apparently 12 key employees have left Yahoo! this year, up from four people the firm counted in 2014. Why? Is it because of Marissa Mayer's truncated maternity leave? Or is it that she is setting a standard that other women find difficult to follow? |

|
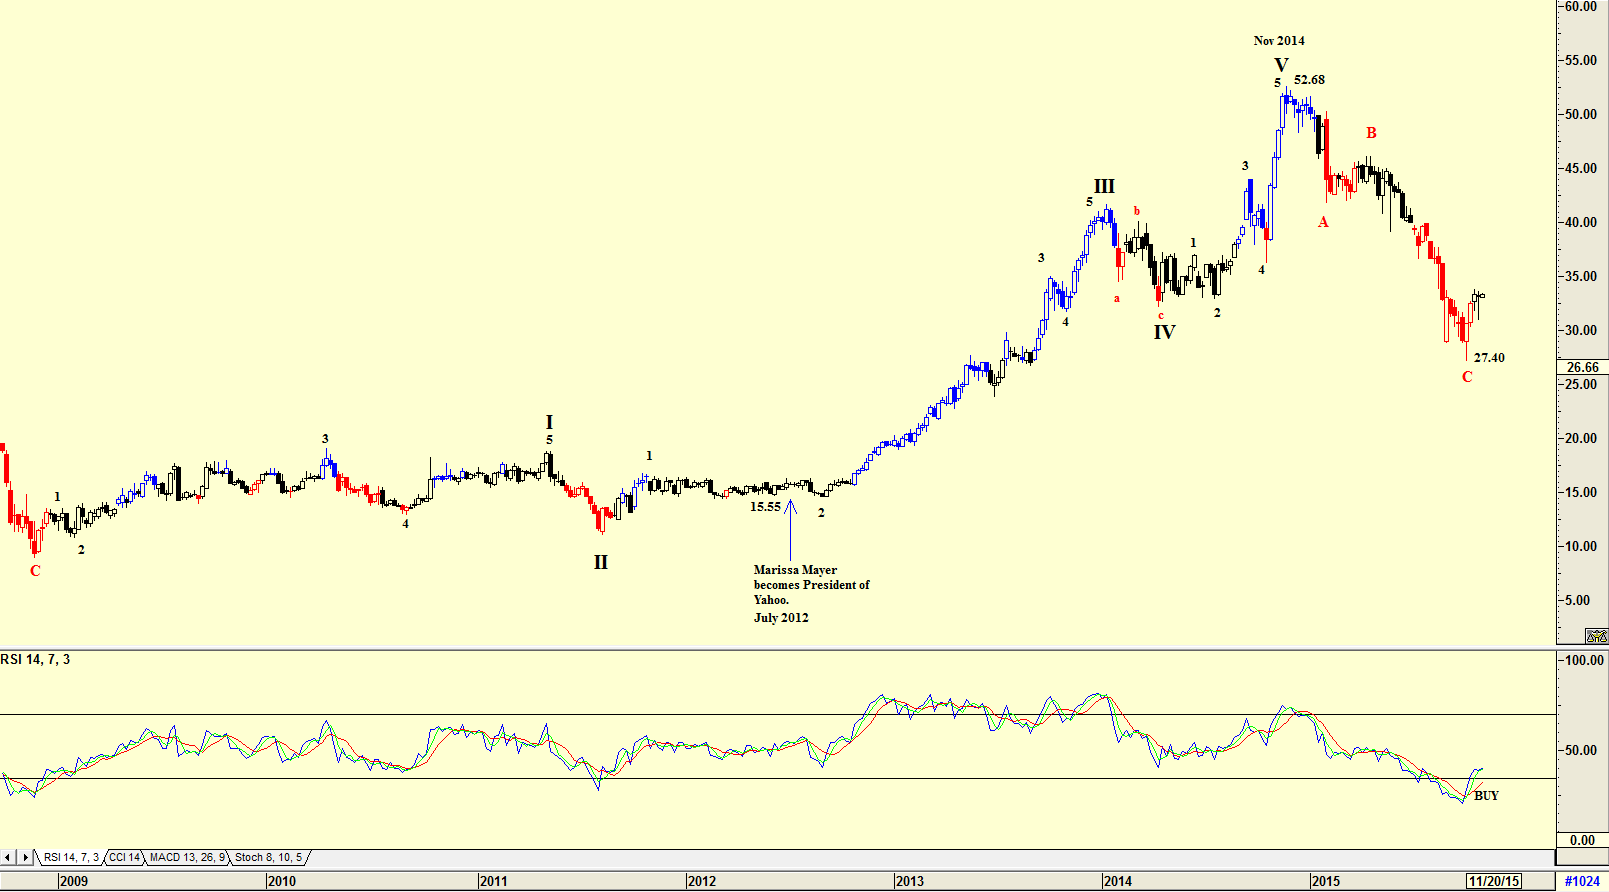
| Figure 1. Weekly chart of YHOO with Elliott wave count. |
| Graphic provided by: AdvancedGET. |
| |
| The chart in Figure 1 is a weekly chart showing when Marissa Mayer became CEO of Yahoo!, and how the share price moved up strongly from a low of $15.55 to a high of $52.68 by November 2014. From that level the share price has fallen to $27.40 in an ABC correction — almost a 50% drop. Is this because of key employees leaving? An Elliott wave count suggests that the share price should now start rising in a WAVE 1 of a new bull trend. This is confirmed by the RSI indicator which has suggested a buy signal. |

|
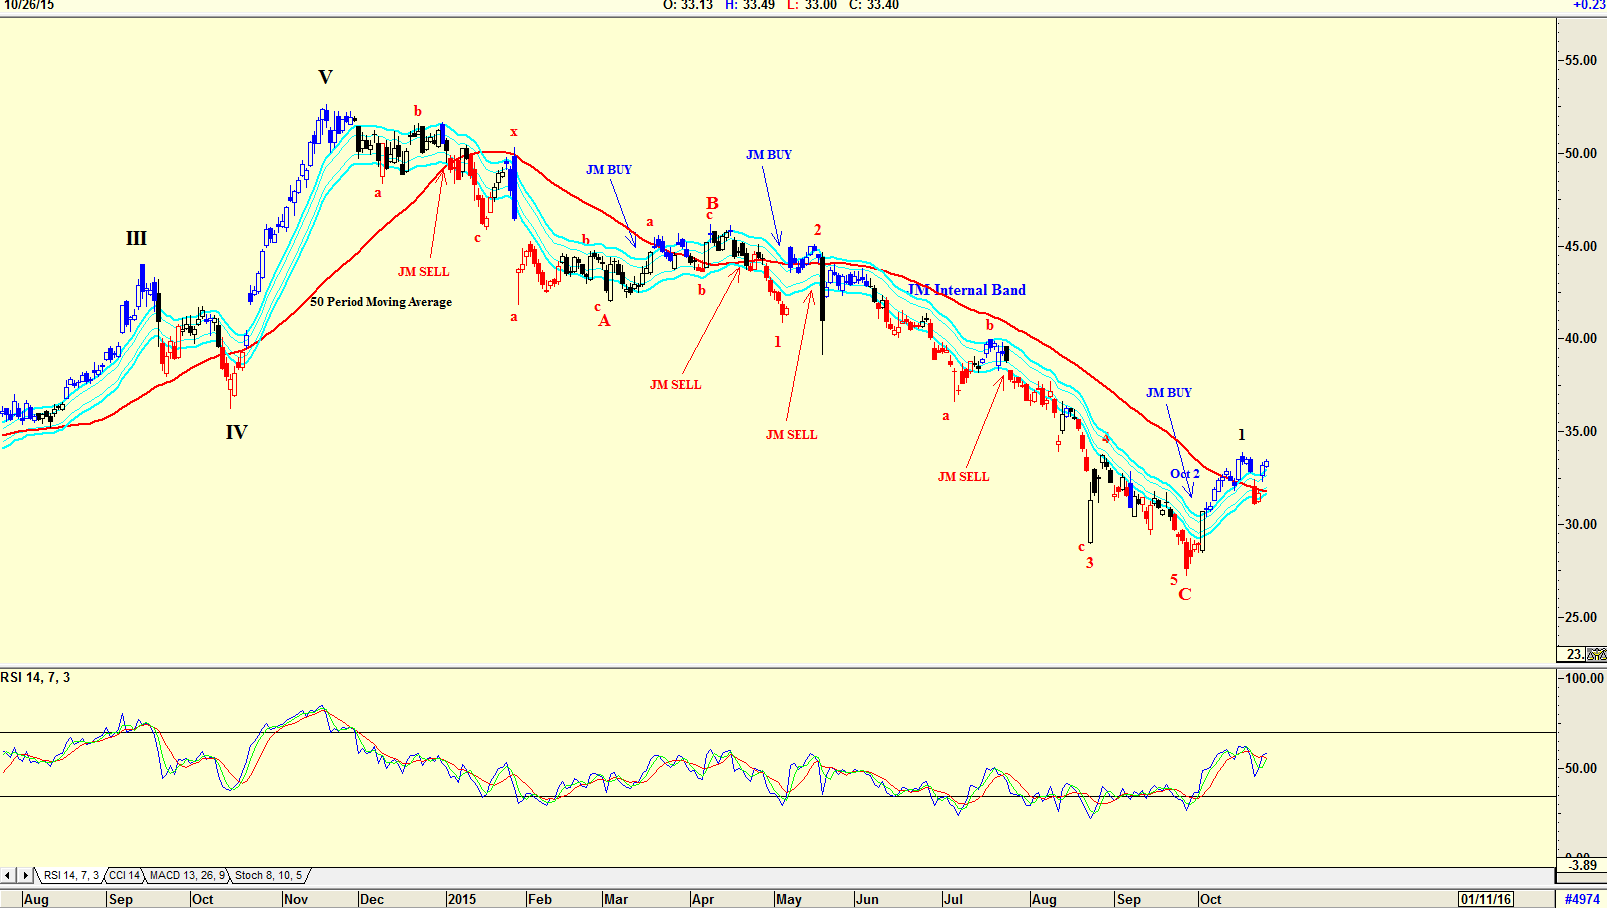
| Figure 2. Daily chart of YHOO showing JM Internal Band. |
| Graphic provided by: AdvancedGET. |
| |
| The chart in Figure 2 is a daily chart showing how the Elliott wave count suggested in Figure 1 has bottomed and is now suggesting a new bull trend with a Wave 1 rise. Note that the RSI is in a rising trend, and that the share price has risen above the 50-period moving average. Also note the JM Internal Band buy signal given on October 2nd. The JM Internal Band is a 15 period simple moving average offset by 2% positive and 2% negative. A move above the upper band suggests a buy and a move below the lower band, a sell. I would be a buyer of Yahoo! shares, but I would prefer to wait for the wave 2 correction before buying. Whatever the fundamental reason for the new bull trend that has started, the share of Yahoo! is a share that should be in one's portfolio. |
Has been a technical analyst since 1969, and has worked as a futures and options trader with First Financial Futures in Johannesburg, South Africa.
| Address: | 3256 West 24th Ave |
| Vancouver, BC | |
| Phone # for sales: | 6042634214 |
| E-mail address: | petroosp@gmail.com |
Click here for more information about our publications!
PRINT THIS ARTICLE

Request Information From Our Sponsors
- VectorVest, Inc.
- Executive Premier Workshop
- One-Day Options Course
- OptionsPro
- Retirement Income Workshop
- Sure-Fire Trading Systems (VectorVest, Inc.)
- Trading as a Business Workshop
- VectorVest 7 EOD
- VectorVest 7 RealTime/IntraDay
- VectorVest AutoTester
- VectorVest Educational Services
- VectorVest OnLine
- VectorVest Options Analyzer
- VectorVest ProGraphics v6.0
- VectorVest ProTrader 7
- VectorVest RealTime Derby Tool
- VectorVest Simulator
- VectorVest Variator
- VectorVest Watchdog
- StockCharts.com, Inc.
- Candle Patterns
- Candlestick Charting Explained
- Intermarket Technical Analysis
- John Murphy on Chart Analysis
- John Murphy's Chart Pattern Recognition
- John Murphy's Market Message
- MurphyExplainsMarketAnalysis-Intermarket Analysis
- MurphyExplainsMarketAnalysis-Visual Analysis
- StockCharts.com
- Technical Analysis of the Financial Markets
- The Visual Investor
