HOT TOPICS LIST
- MACD
- Fibonacci
- RSI
- Gann
- ADXR
- Stochastics
- Volume
- Triangles
- Futures
- Cycles
- Volatility
- ZIGZAG
- MESA
- Retracement
- Aroon
INDICATORS LIST
LIST OF TOPICS
PRINT THIS ARTICLE
by Koos van der Merwe
So, Oprah Winfrey has bought into Weight Watchers. Should you buy the share?
Position: Buy
Koos van der Merwe
Has been a technical analyst since 1969, and has worked as a futures and options trader with First Financial Futures in Johannesburg, South Africa.
PRINT THIS ARTICLE
TECHNICAL ANALYSIS
Weight Watchers
10/23/15 04:05:14 PMby Koos van der Merwe
So, Oprah Winfrey has bought into Weight Watchers. Should you buy the share?
Position: Buy
| We all know that Weight Watchers International, Inc. provides weight management services worldwide. We also know, especially those viewers that were addicted to the Oprah Winfrey show, that Oprah was a regular follower of Weight Watchers. Now, with her buying into the company, is it time to follow her and buy the stock? |

|
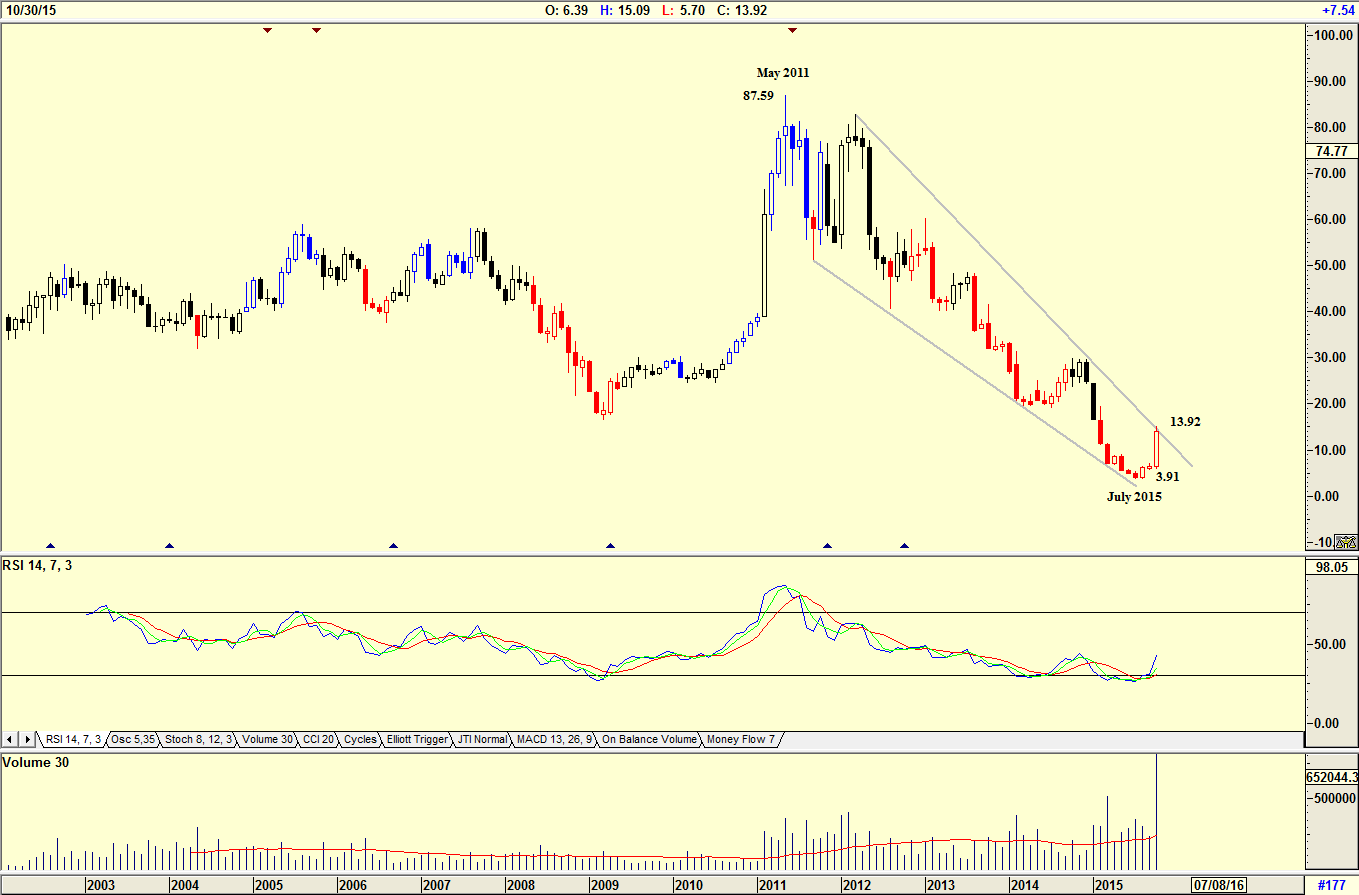
| Figure 1. Monthly chart for WTW. |
| Graphic provided by: AdvancedGET. |
| |
| The chart in Figure 1 is a monthly chart showing how the share price reached a high of $87.59 by May 2011, and has from that date, fallen to a low of $3.91 by July 2015. Notice how volume rose strongly over this period, suggesting weakness. However, with the RSI indicator at oversold levels, one can now expect the share to start recovering and with Oprah's announcement, the share has risen strongly to $13.92. |

|
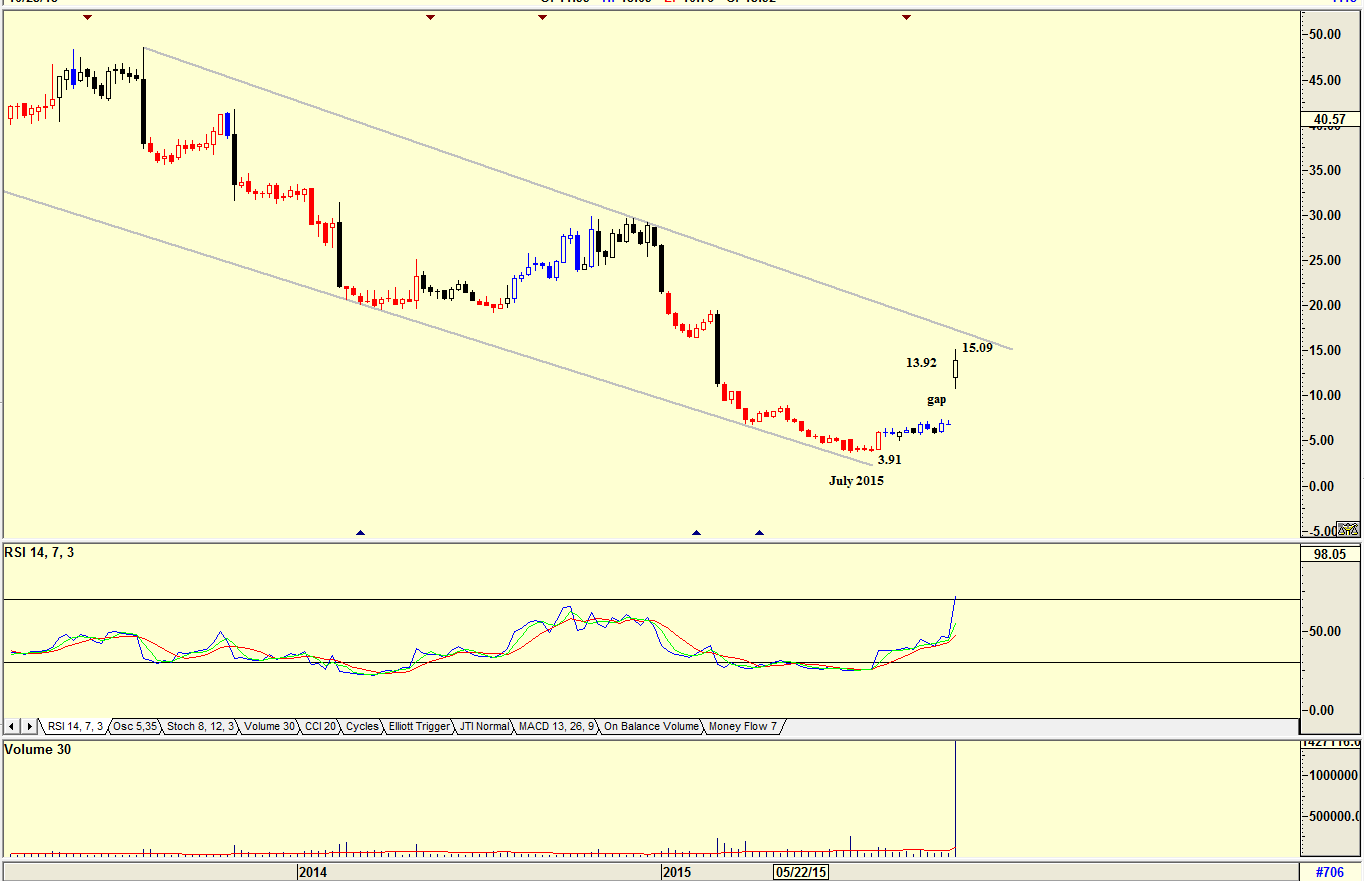
| Figure 2. Weekly chart for WTW. |
| Graphic provided by: AdvancedGET. |
| |
| The weekly chart in Figure 2 shows how the share price rose on a gap to $15.09 on the announcement, then fell back to close at $13.92. Note that the RSI is at overbought levels, and could suggest a sell in the near future. Also note the strong increase in volume as investors bought into the stock on the announcement. As I write this article (October 20th) the share price is trading at $17.80 on above average volume, suggesting that many Oprah followers are buying into the stock. |

|
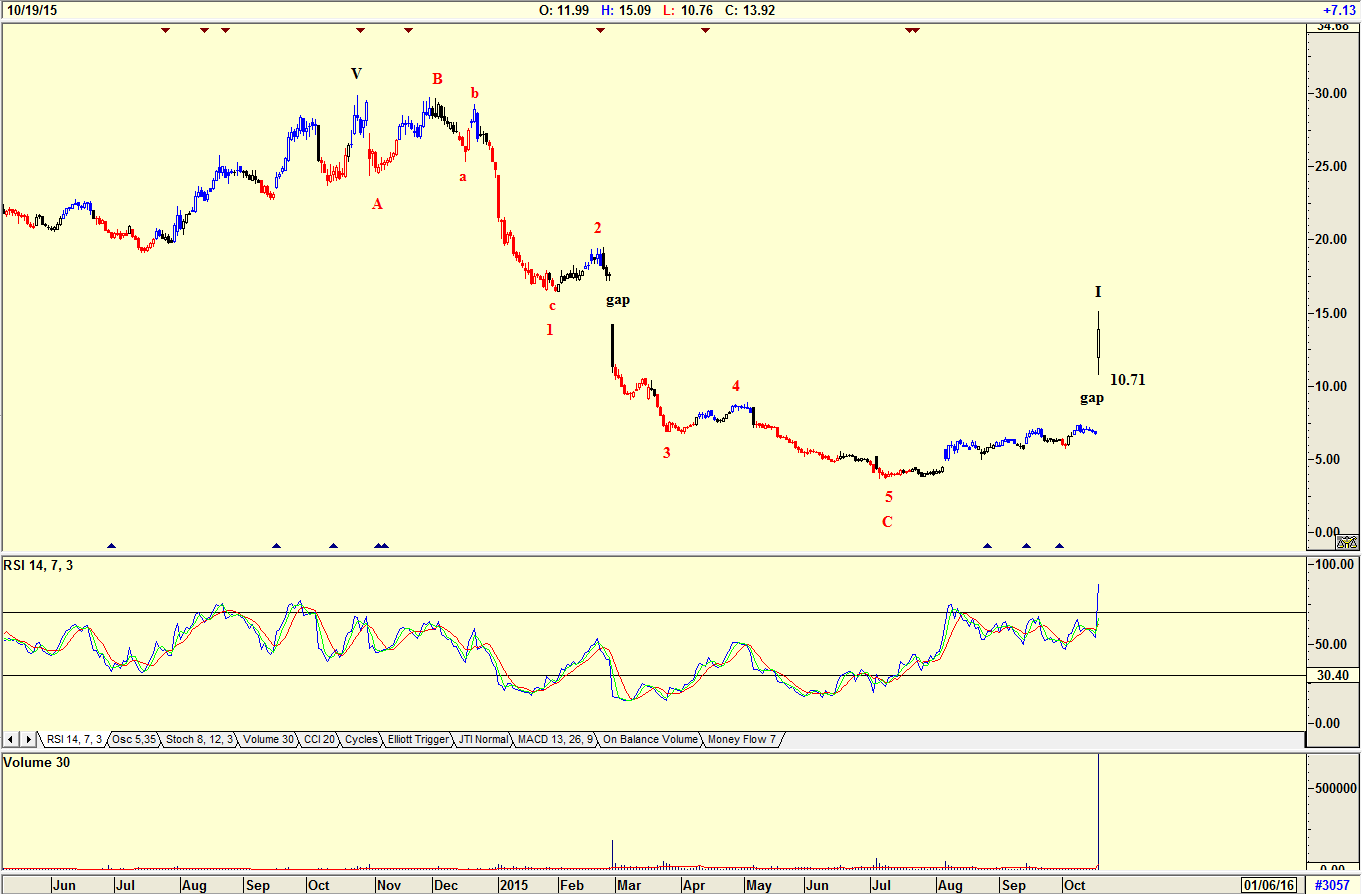
| Figure 3. Daily chart showing the gap following Oprah's announcement. |
| Graphic provided by: AdvancedGET. |
| |
| The chart in Figure 3 is a daily chart with an Elliott wave count suggesting that the share price could be in a WAVE I bull trend. The gap shown on the chart when Oprah Winfrey made her announcement could be filled as expected once the hype has settled. This means that the share price could fall to $10.71, and with the RSI at oversold levels this is indeed a possibility, but it may take some time before it happens. With the announcement that Oprah Winfrey's name can be used in their advertising, the share price may well rise before settling. |

|
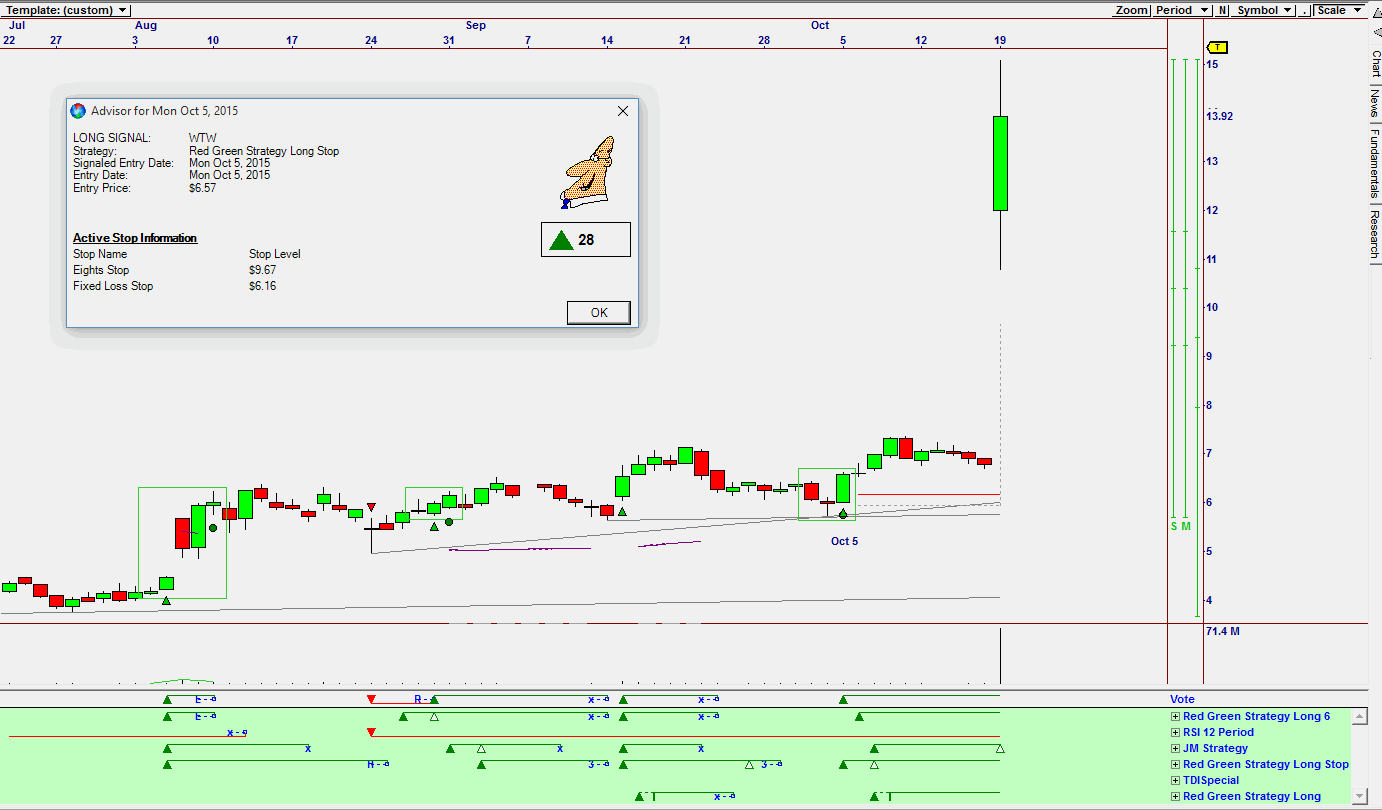
| Figure 4. Omnitrader Chart showing the buy signal given on October 5th. |
| Graphic provided by: Omnitrader. |
| |
| The chart in Figure 4 is an Omnitrader chart showing how the Vote line gave a buy signal on October 5th based on the Red Green strategy Long Stop. The Advisor rating was 28, which is not a strong rating. However, when the other strategies started following suit — especially the JM Strategy — one may have been tempted to buy the share. The JM Strategy is based on the JM internal band which is a 15 period moving average offset by 2% positive and 2% negative. A buy signal is suggested when the share price moves above the upper band. Following Oprah Winfrey in buying into Weight Watchers is very tempting, especially for a short term gain. For the long term, I would prefer to wait for a correction possibly to "fill the gap" before buying the stock. |
Has been a technical analyst since 1969, and has worked as a futures and options trader with First Financial Futures in Johannesburg, South Africa.
| Address: | 3256 West 24th Ave |
| Vancouver, BC | |
| Phone # for sales: | 6042634214 |
| E-mail address: | petroosp@gmail.com |
Click here for more information about our publications!
Comments
Date: 10/24/15Rank: 5Comment:

Request Information From Our Sponsors
- StockCharts.com, Inc.
- Candle Patterns
- Candlestick Charting Explained
- Intermarket Technical Analysis
- John Murphy on Chart Analysis
- John Murphy's Chart Pattern Recognition
- John Murphy's Market Message
- MurphyExplainsMarketAnalysis-Intermarket Analysis
- MurphyExplainsMarketAnalysis-Visual Analysis
- StockCharts.com
- Technical Analysis of the Financial Markets
- The Visual Investor
- VectorVest, Inc.
- Executive Premier Workshop
- One-Day Options Course
- OptionsPro
- Retirement Income Workshop
- Sure-Fire Trading Systems (VectorVest, Inc.)
- Trading as a Business Workshop
- VectorVest 7 EOD
- VectorVest 7 RealTime/IntraDay
- VectorVest AutoTester
- VectorVest Educational Services
- VectorVest OnLine
- VectorVest Options Analyzer
- VectorVest ProGraphics v6.0
- VectorVest ProTrader 7
- VectorVest RealTime Derby Tool
- VectorVest Simulator
- VectorVest Variator
- VectorVest Watchdog
