HOT TOPICS LIST
- MACD
- Fibonacci
- RSI
- Gann
- ADXR
- Stochastics
- Volume
- Triangles
- Futures
- Cycles
- Volatility
- ZIGZAG
- MESA
- Retracement
- Aroon
INDICATORS LIST
LIST OF TOPICS
PRINT THIS ARTICLE
by Koos van der Merwe
When a head & shoulders formation has completed its retracement, do you buy the stock?
Position: Accumulate
Koos van der Merwe
Has been a technical analyst since 1969, and has worked as a futures and options trader with First Financial Futures in Johannesburg, South Africa.
PRINT THIS ARTICLE
HEAD & SHOULDERS
A Completed Head & Shoulders
10/05/15 02:18:47 PMby Koos van der Merwe
When a head & shoulders formation has completed its retracement, do you buy the stock?
Position: Accumulate
| A head & shoulders formation is one of the most common and also the most reliable of all major reversal patterns. When the target suggested has been reached, (or close to it) do you buy the stock? NXP Semiconductor (NXPI) is a stock that has recently completed a head & shoulders pattern. Let's take a look at it. NXP Semiconductors creates solutions that enable secure connections for a smarter world. The company is driving innovation in the area of connected car security, portable and wearable and %91The Internet of Things.' With operations in more than 25 countries, the company posted revenue of more than $5.65 billion in 2014. |

|
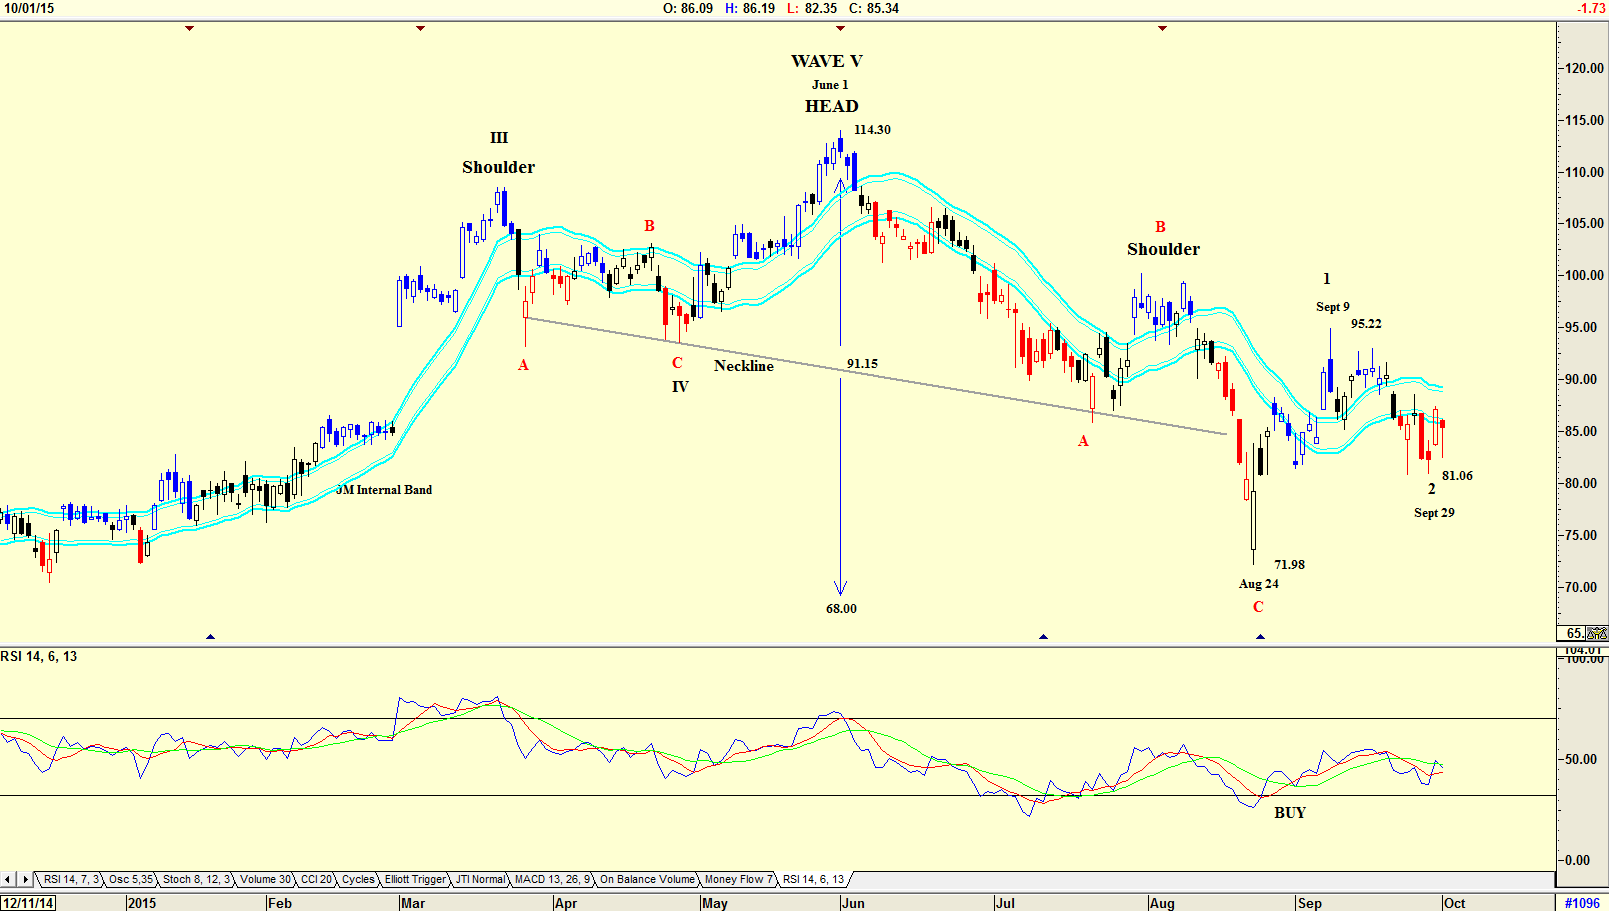
| Figure 1. Daily chart showing the Head and Shoulder formation. |
| Graphic provided by: AdvancedGET. |
| |
| The chart in Figure 1 is a daily chart showing the head & shoulders formation. The head reached a high of $114.30 on June 1, 2015 and with the neckline at $91.15 on that day, the target for the correction is $68.00. (114.30-91.15=23.15. 91.15 - 23,15 = 68.00). The stock price fell to $71.98 by August 24, 2015 close enough to the target to be acceptable. An Elliott wave count suggests that the head that formed on June 1, 2015 is a WAVE V top, and that the correction to $71.98 is an ABC correction. Note that the relative strength index (RSI) gave a buy on August 24, 2015 when the share price was $71.98. This means that the rise to $95.22 on September 9, 2015 could be a Wave 1 with the correction to $81.06 by September 29, 2015 a Wave 2. Note the JM Internal Band indicator which is still negative. The JM Internal Band is a simple 15-period moving average offset by 2% positive and 2% negative. A move above the upper band suggests a buy and below the lower band a sell. The share price is still below the lower band. |

|
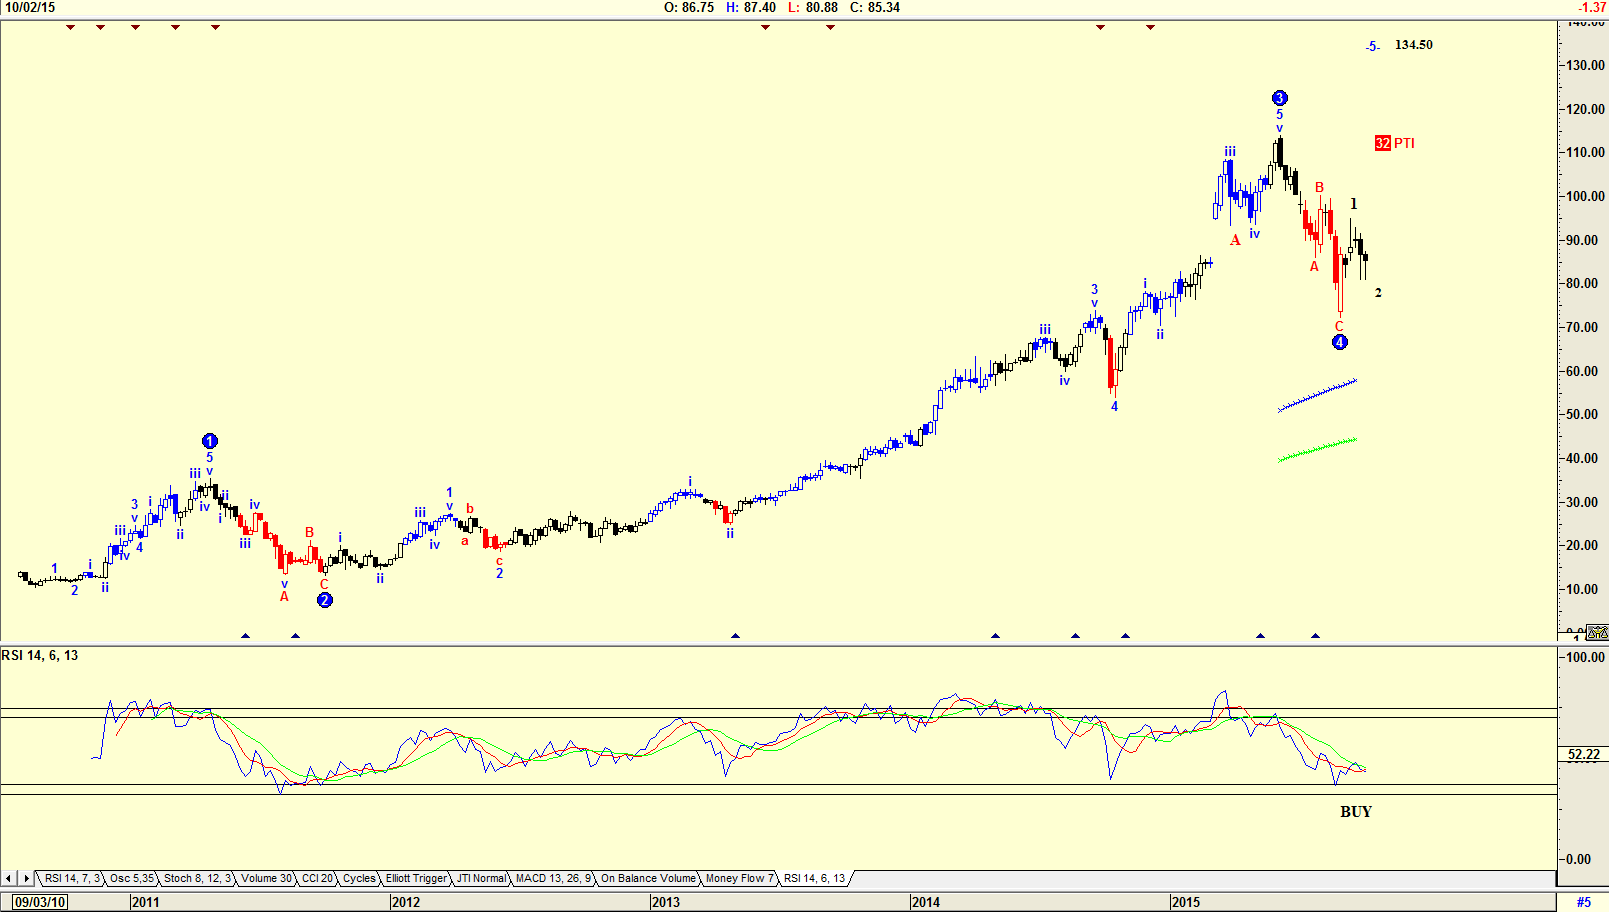
| Figure 2. Weekly chart with Elliott Wave count |
| Graphic provided by: AdvancedGET. |
| |
| The chart in Figure 2 is a weekly chart with an Elliott wave count showing that a WAVE 4 has been completed and that the price of the stock should now rise in a WAVE 5 to $134.50. The PTI (Probability Index) at 32 is weak, and with an RSI still trending down, we could expect a little more weakness before Wave 2 of WAVE 5 bottoms. Note that the colour of the candlestick bar is black, which suggests neutrality. A blue color suggests a buy, and a red color a sell. A trader could look at the stock for a buy. An investor should wait for a move above the JM Internal Band before buying. |
Has been a technical analyst since 1969, and has worked as a futures and options trader with First Financial Futures in Johannesburg, South Africa.
| Address: | 3256 West 24th Ave |
| Vancouver, BC | |
| Phone # for sales: | 6042634214 |
| E-mail address: | petroosp@gmail.com |
Click here for more information about our publications!
Comments
Date: 10/24/15Rank: 5Comment:

|

Request Information From Our Sponsors
- StockCharts.com, Inc.
- Candle Patterns
- Candlestick Charting Explained
- Intermarket Technical Analysis
- John Murphy on Chart Analysis
- John Murphy's Chart Pattern Recognition
- John Murphy's Market Message
- MurphyExplainsMarketAnalysis-Intermarket Analysis
- MurphyExplainsMarketAnalysis-Visual Analysis
- StockCharts.com
- Technical Analysis of the Financial Markets
- The Visual Investor
- VectorVest, Inc.
- Executive Premier Workshop
- One-Day Options Course
- OptionsPro
- Retirement Income Workshop
- Sure-Fire Trading Systems (VectorVest, Inc.)
- Trading as a Business Workshop
- VectorVest 7 EOD
- VectorVest 7 RealTime/IntraDay
- VectorVest AutoTester
- VectorVest Educational Services
- VectorVest OnLine
- VectorVest Options Analyzer
- VectorVest ProGraphics v6.0
- VectorVest ProTrader 7
- VectorVest RealTime Derby Tool
- VectorVest Simulator
- VectorVest Variator
- VectorVest Watchdog
