HOT TOPICS LIST
- MACD
- Fibonacci
- RSI
- Gann
- ADXR
- Stochastics
- Volume
- Triangles
- Futures
- Cycles
- Volatility
- ZIGZAG
- MESA
- Retracement
- Aroon
INDICATORS LIST
LIST OF TOPICS
PRINT THIS ARTICLE
by Koos van der Merwe
How successful is a double top formation?
Position: Sell
Koos van der Merwe
Has been a technical analyst since 1969, and has worked as a futures and options trader with First Financial Futures in Johannesburg, South Africa.
PRINT THIS ARTICLE
DOUBLE TOPS
Another Look At Amazon
09/29/15 12:49:17 PMby Koos van der Merwe
How successful is a double top formation?
Position: Sell
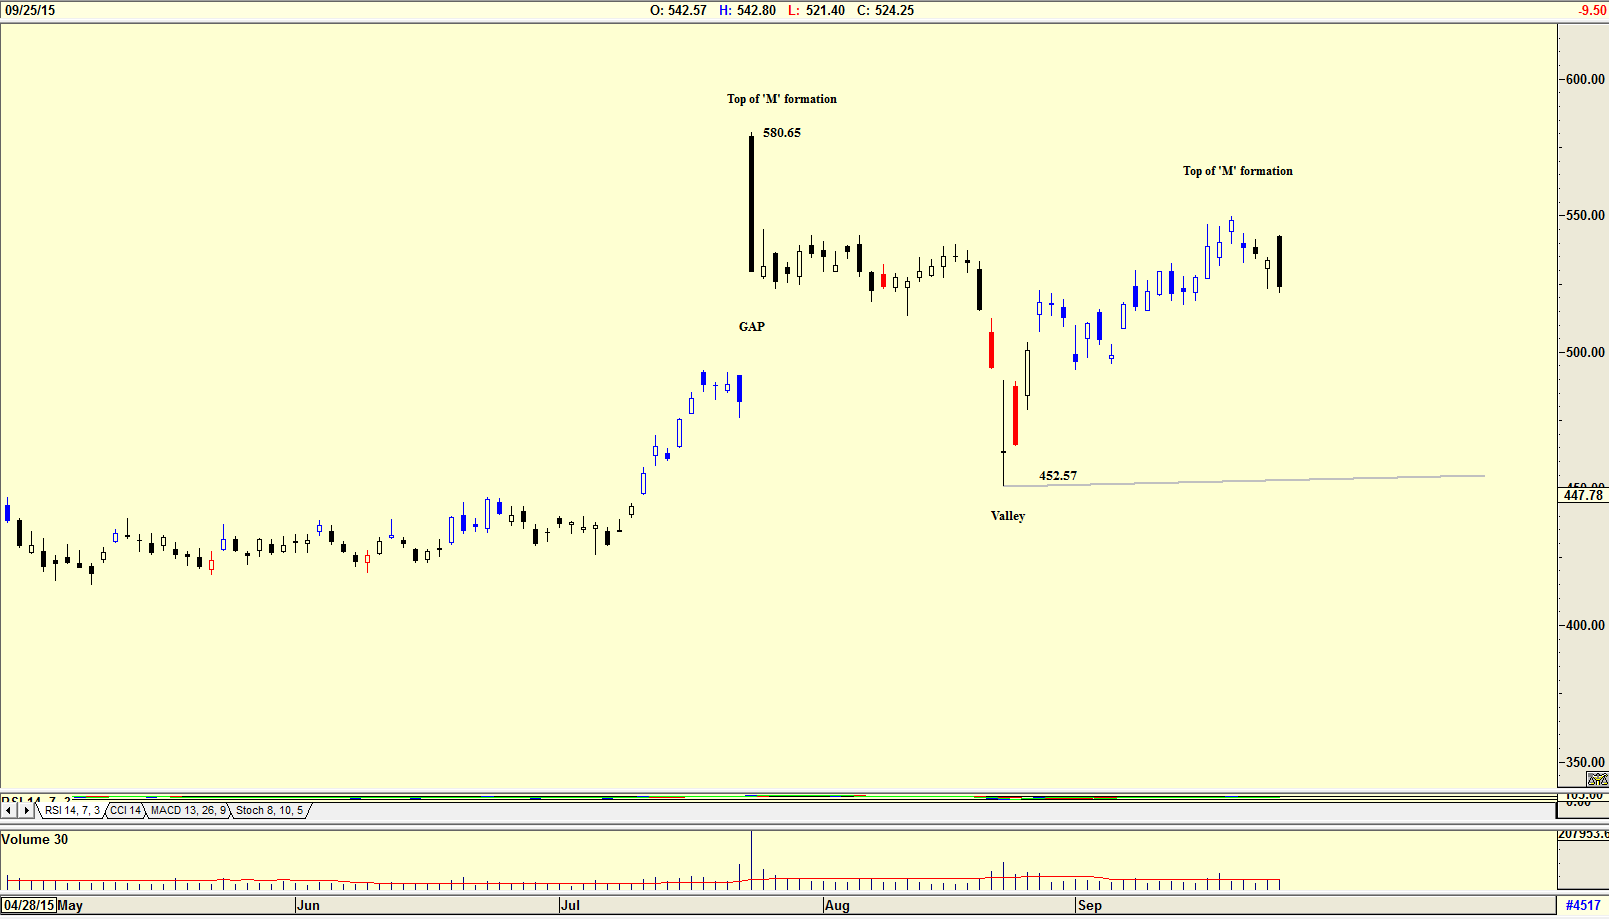
| A double top formation appears as an 'M' on a chart. They are very popular but often may be mislabeled and misinterpreted. In any uptrend, after a market reaction, each new wave that forms appears to be making a double top, but often there is no evidence pointing to the formation. Nine times out of ten, the primary trend will remain in force and prices will simply go on and make new highs. The only time a double top is confirmed is when the valley, that is the downside of the 'M' formation, is broken. |

|
| Figure 1. Daily chart showing the possible double top ('M') formation. |
| Graphic provided by: AdvancedGET. |
| |
| The chart in Figure 1 is a daily chart of Amazon showing the 'M' formation, double top that has formed. This will only be confirmed as a sell should the price fall below the valley, at $452.57. Should this happen, the formation suggests a target to the downside to $324.49. (580.65-452.57=128.08. 452.57-128.08=324.49). With the current negativity in the market this is indeed possible. However, one should look at other indicators before making a final decision. |

|
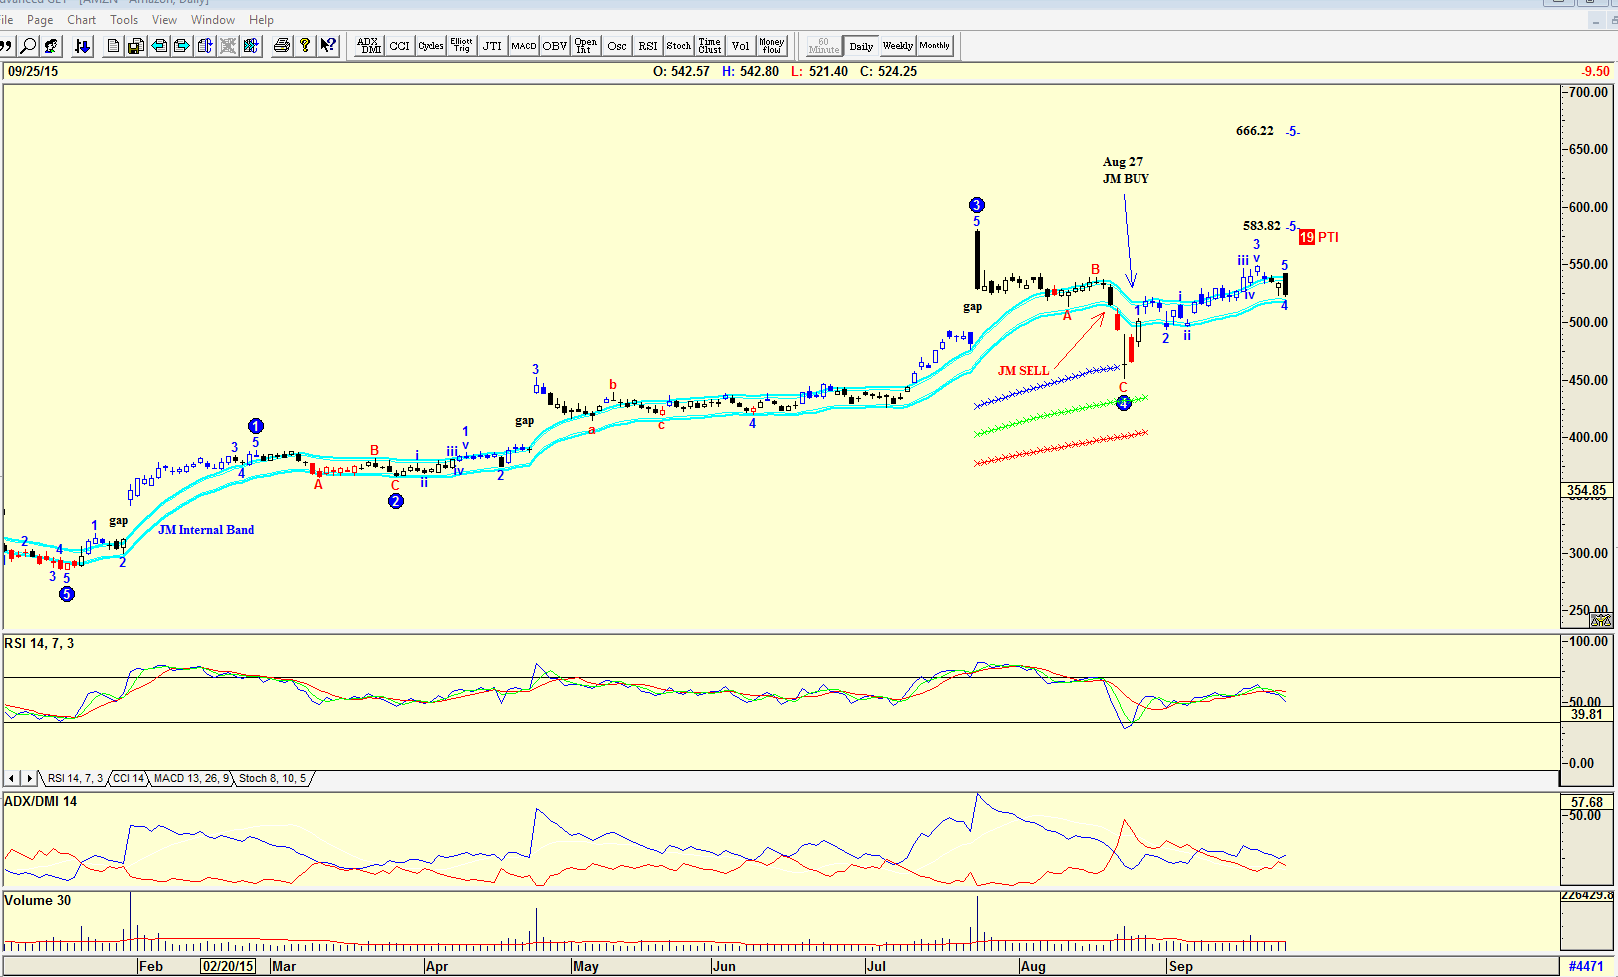
| Figure 2. Daily chart with Elliott wave count. |
| Graphic provided by: AdvancedGET. |
| |
| The chart in Figure 2 is another daily chart with an Elliott wave count suggesting that Amazon could be in a WAVE 5 up with a target of either $583.82 or $666.23. However the Probability Index (PTI) is at 19, which is very low, suggesting that this is unlikely to happen. Do notice the JM internal band buy on August 27th. A JM internal band is a 15 period simple moving average offset by 2% positive and 2% negative. A move above the upper band suggests a buy and below the lower band a sell as shown on the chart. The price currently is flirting with the lower band but has not given a sell signal. Do note the RSI indicator which is still trending upwards and the ADX/DMI indicator where the blue line has not broken below the red line suggesting a sell. Volume presently is below average. |

|
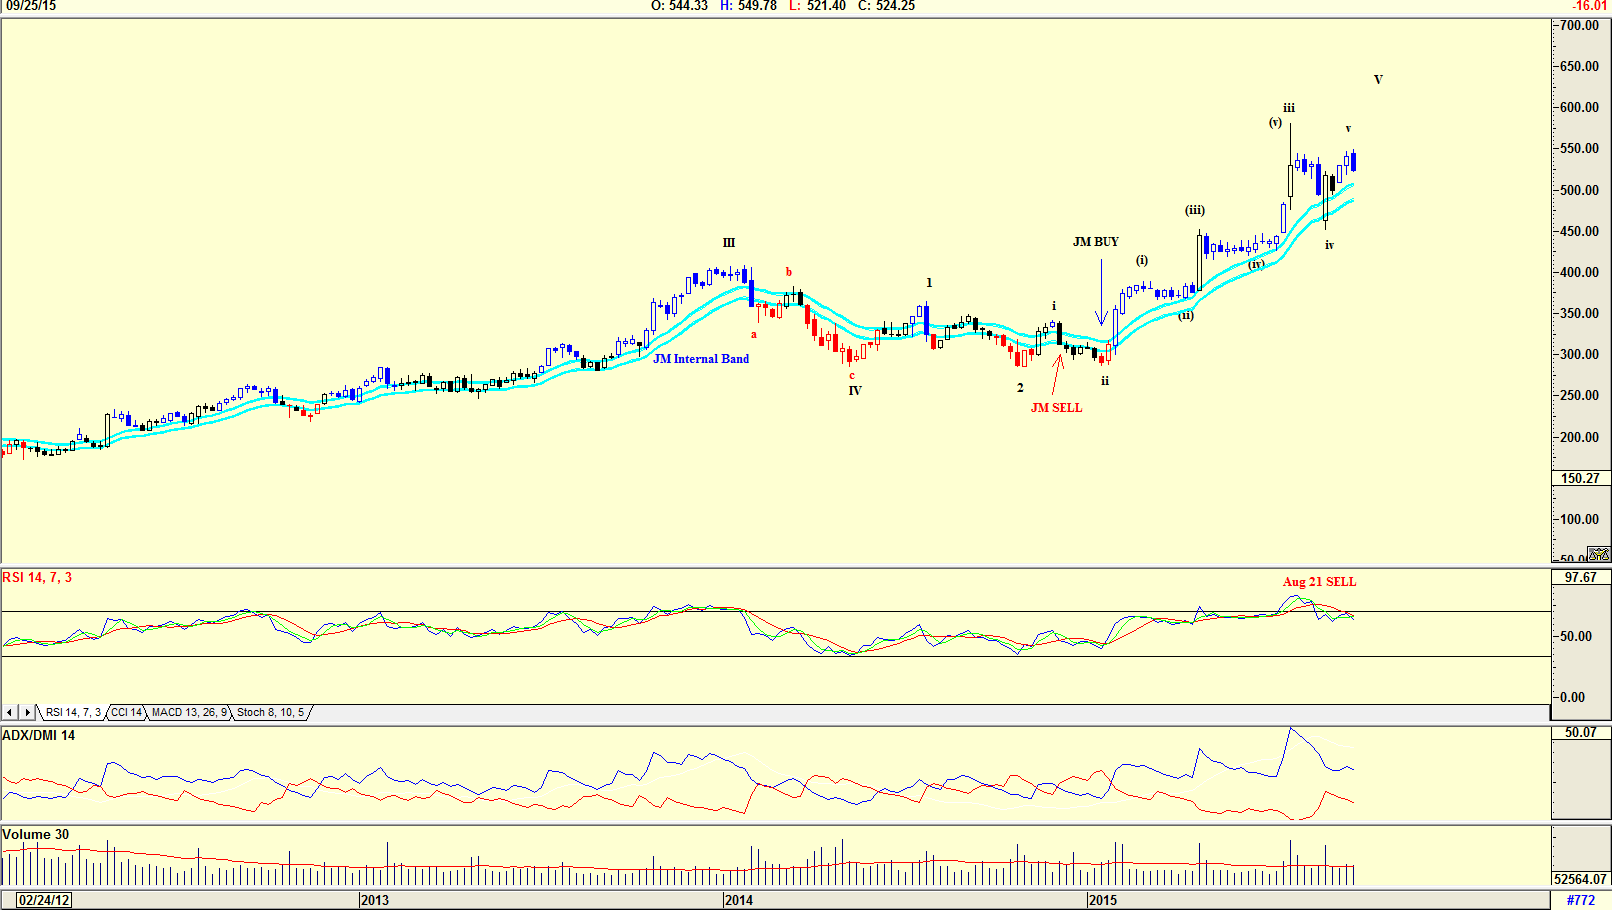
| Figure 3. Weekly chart suggesting weakness ahead. |
| Graphic provided by: AdvancedGET. |
| |
| The chart in Figure 3 is a weekly chart with an Elliott wave count suggesting that the share price could be in a Wave v of WAVE V. Note the RSI indicator which gave a SELL signal on August 21st. Also notice the ADX/DMI which is still in buy mode but is suggesting possible weakness ahead. Volume is also below average suggesting weakness as the price rose and fell. The price is still above the JM internal band indicator. I would not be a buyer of Amazon at present levels, no matter how tempting the share price could be. The 'M' formation could truly form as suggested by the daily and weekly charts. I would prefer to wait until all the buy parameters are met and a clearer market direction is given. |
Has been a technical analyst since 1969, and has worked as a futures and options trader with First Financial Futures in Johannesburg, South Africa.
| Address: | 3256 West 24th Ave |
| Vancouver, BC | |
| Phone # for sales: | 6042634214 |
| E-mail address: | petroosp@gmail.com |
Click here for more information about our publications!
PRINT THIS ARTICLE

Request Information From Our Sponsors
- StockCharts.com, Inc.
- Candle Patterns
- Candlestick Charting Explained
- Intermarket Technical Analysis
- John Murphy on Chart Analysis
- John Murphy's Chart Pattern Recognition
- John Murphy's Market Message
- MurphyExplainsMarketAnalysis-Intermarket Analysis
- MurphyExplainsMarketAnalysis-Visual Analysis
- StockCharts.com
- Technical Analysis of the Financial Markets
- The Visual Investor
- VectorVest, Inc.
- Executive Premier Workshop
- One-Day Options Course
- OptionsPro
- Retirement Income Workshop
- Sure-Fire Trading Systems (VectorVest, Inc.)
- Trading as a Business Workshop
- VectorVest 7 EOD
- VectorVest 7 RealTime/IntraDay
- VectorVest AutoTester
- VectorVest Educational Services
- VectorVest OnLine
- VectorVest Options Analyzer
- VectorVest ProGraphics v6.0
- VectorVest ProTrader 7
- VectorVest RealTime Derby Tool
- VectorVest Simulator
- VectorVest Variator
- VectorVest Watchdog
