

HOT TOPICS LIST
- MACD
- Fibonacci
- RSI
- Gann
- ADXR
- Stochastics
- Volume
- Triangles
- Futures
- Cycles
- Volatility
- ZIGZAG
- MESA
- Retracement
- Aroon
INDICATORS LIST
LIST OF TOPICS
PRINT THIS ARTICLE
by Koos van der Merwe
In the past, when the economy and the stock market looked bad, money moved to gold.
Position: Accumulate
Koos van der Merwe
Has been a technical analyst since 1969, and has worked as a futures and options trader with First Financial Futures in Johannesburg, South Africa.
PRINT THIS ARTICLE
TECHNICAL ANALYSIS
Is It Time To Buy Gold?
09/22/15 02:43:44 PMby Koos van der Merwe
In the past, when the economy and the stock market looked bad, money moved to gold.
Position: Accumulate
| Gold experts say that they believe that today there is more gold out of the ground than in the ground. Many of the mines in South Africa, once the largest gold mining country in the world, have closed down. In 1946, the Bretton Woods System created a system of fixed exchange rates that allowed governments to sell their gold to the treasury of the United States of America at the fixed price of $35 per ounce. This system ended in 1971 when President Richard Nixon ended the trading of gold at a fixed price. For the first time in history, formal links between the major world currencies and real commodities were severed. The gold price started to soar based on market forces. Today, people invest in gold to offset stock market declines, hedge against inflation and counteract a declining dollar. But is gold the safe haven many investors believe it is? A safe haven protects investors against a possible catastrophe. With the financial crises of 2008, many investors bought gold, and the price of gold skyrocketed and continued to skyrocket in response to the Eurozone crises, the impact of Obamacare, the Dodd-Frank Wall Street Reform Act and the 2011 debt ceiling crises. Because of economic uncertainty, gold prices more than doubled, moving from $869.75 in 2008 to a high of $1895 on September 5, 2011. With the present economic uncertainty starting to take center stage, is it time to start investing in gold again? |
|
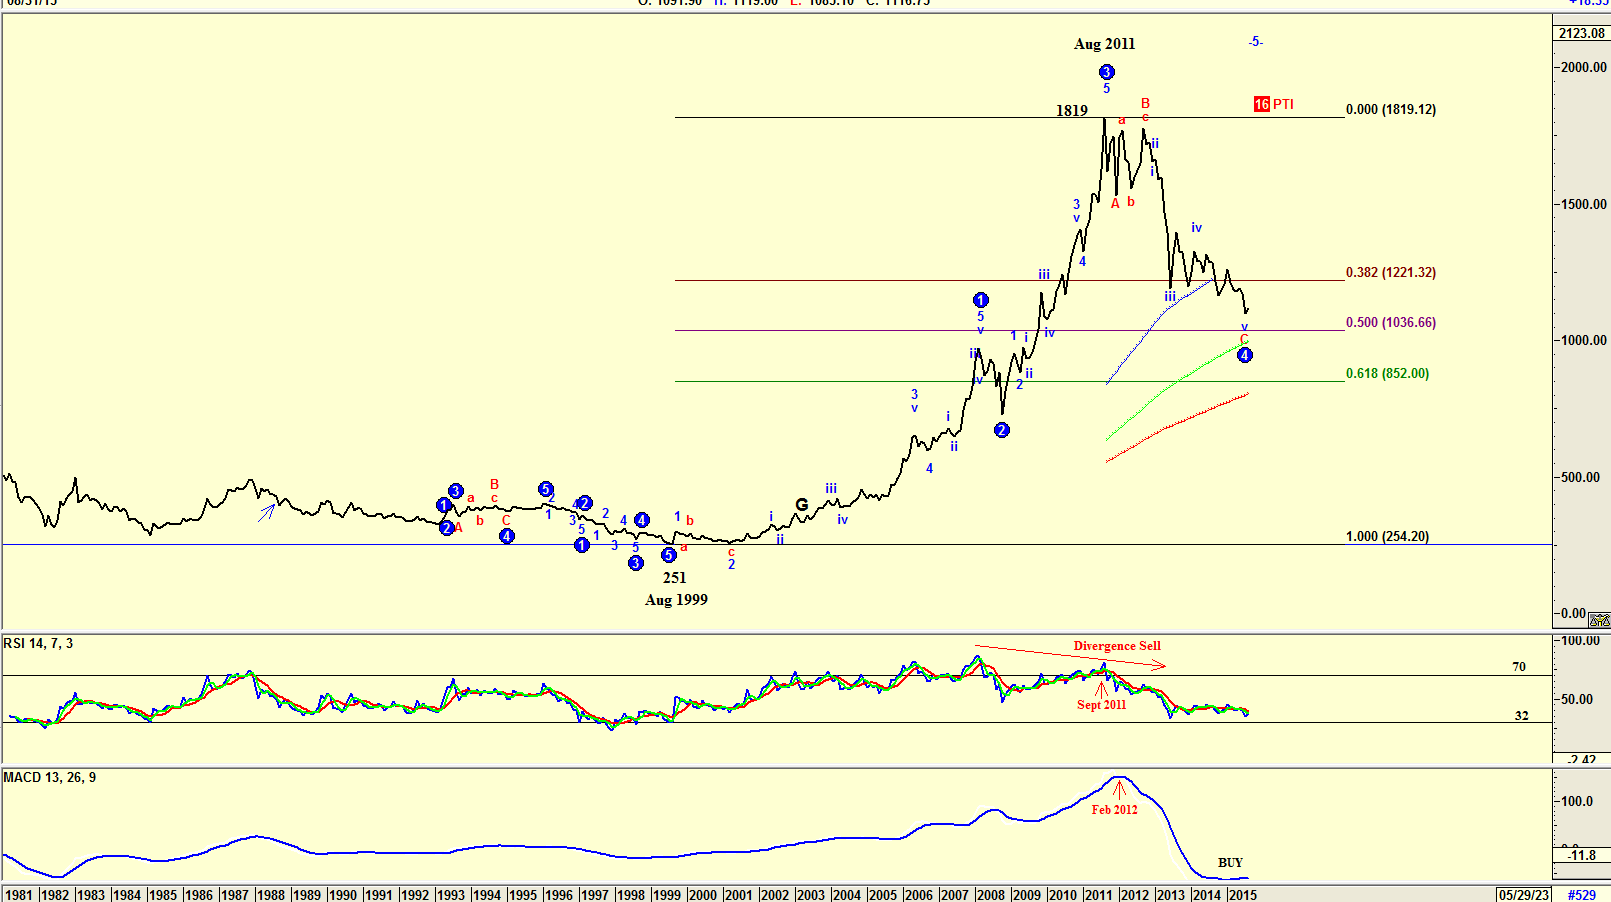
| Figure 1. Monthly chart of the London Gold price. |
| Graphic provided by: AdvancedGET. |
| |
| The chart in Figure 1 is a monthly chart of the London Gold price. The chart shows how the price of gold rose from $251 an ounce in August 1999 to a high of $1819 by August 2011. Do note the divergence sell signal of the RSI indicator in September 2011 and the sell signal given by the MACD indicator in February 2012. The Elliott wave count suggested by the Advanced GET program gives the high of August 2011 as a WAVE 3, with the present price looking for a WAVE 4 bottom. The Fibonacci retracement suggests that this could be at the 50% retracement of $1036.66. With the RSI indicator flirting with the 32 horizontal line, and the MACD suggesting a buy the gold price could very well start rising. However, with the PTI (Probability Index) at 16, this is very unlikely. The PTI should be above 32 to be effective. |
|
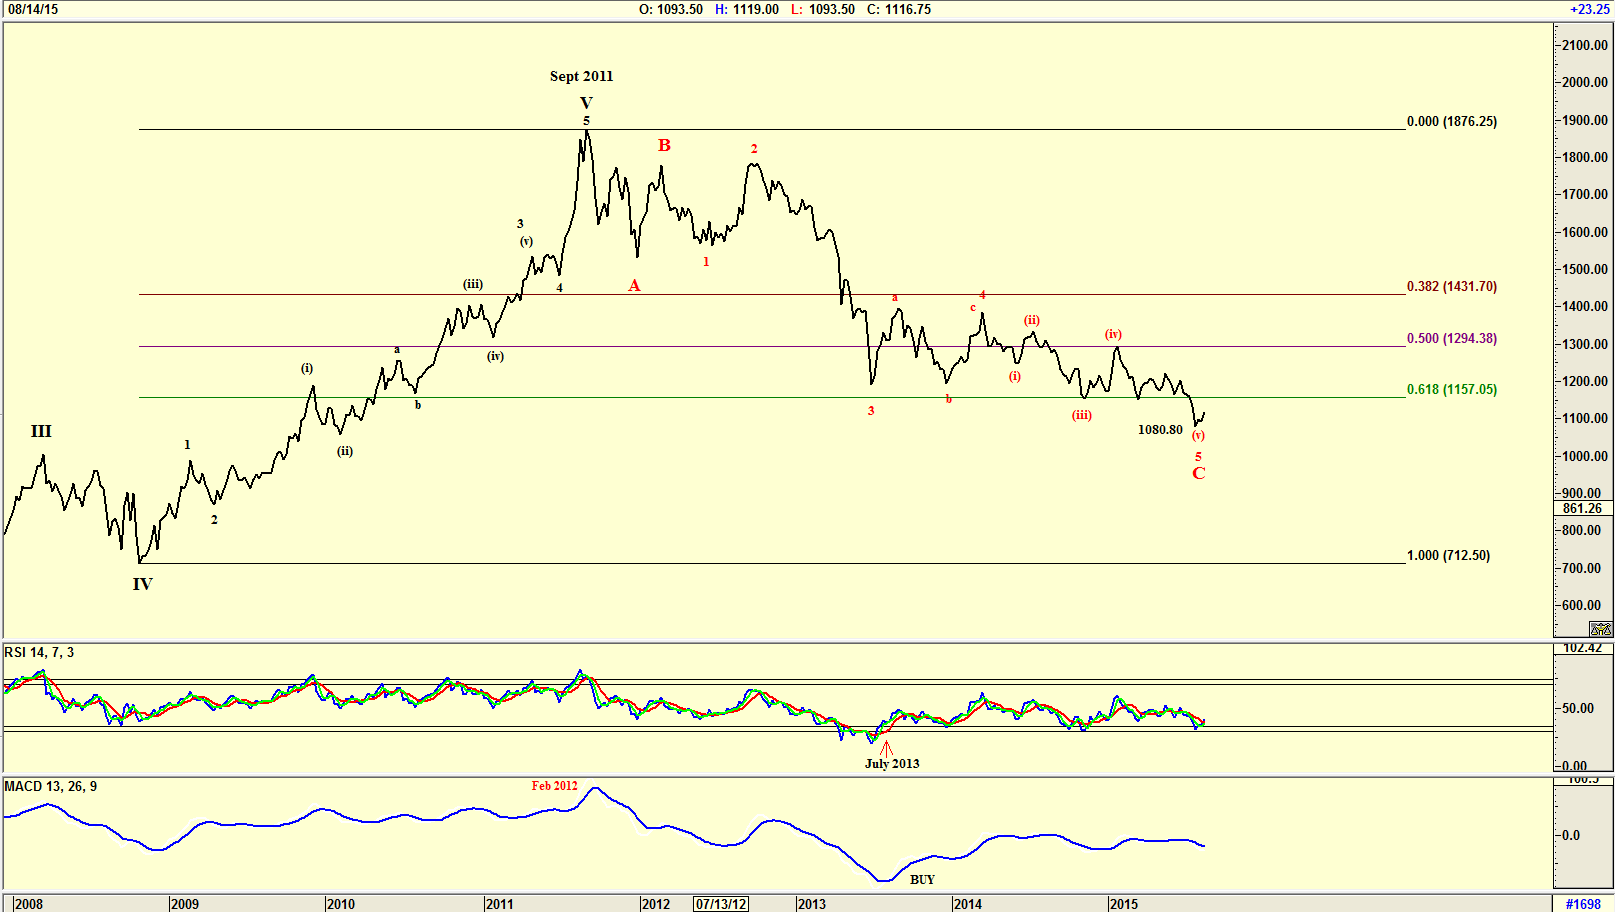
| Figure 2. Weekly chart of the London Gold price. |
| Graphic provided by: AdvancedGET. |
| |
| The weekly chart in Figure 2 suggests that the high of September 2011 is a WAVE V with an ABC retracement that has fallen below the 61.8% Fibonacci retracement level to $1080.80. Once again the RSI indicator is suggesting a buy after a few buy signals which were short term only. The MACD indicator also gave numerous short term buys. The question now is, has gold bottomed at $1080.80, or can it fall to lower levels. |
|
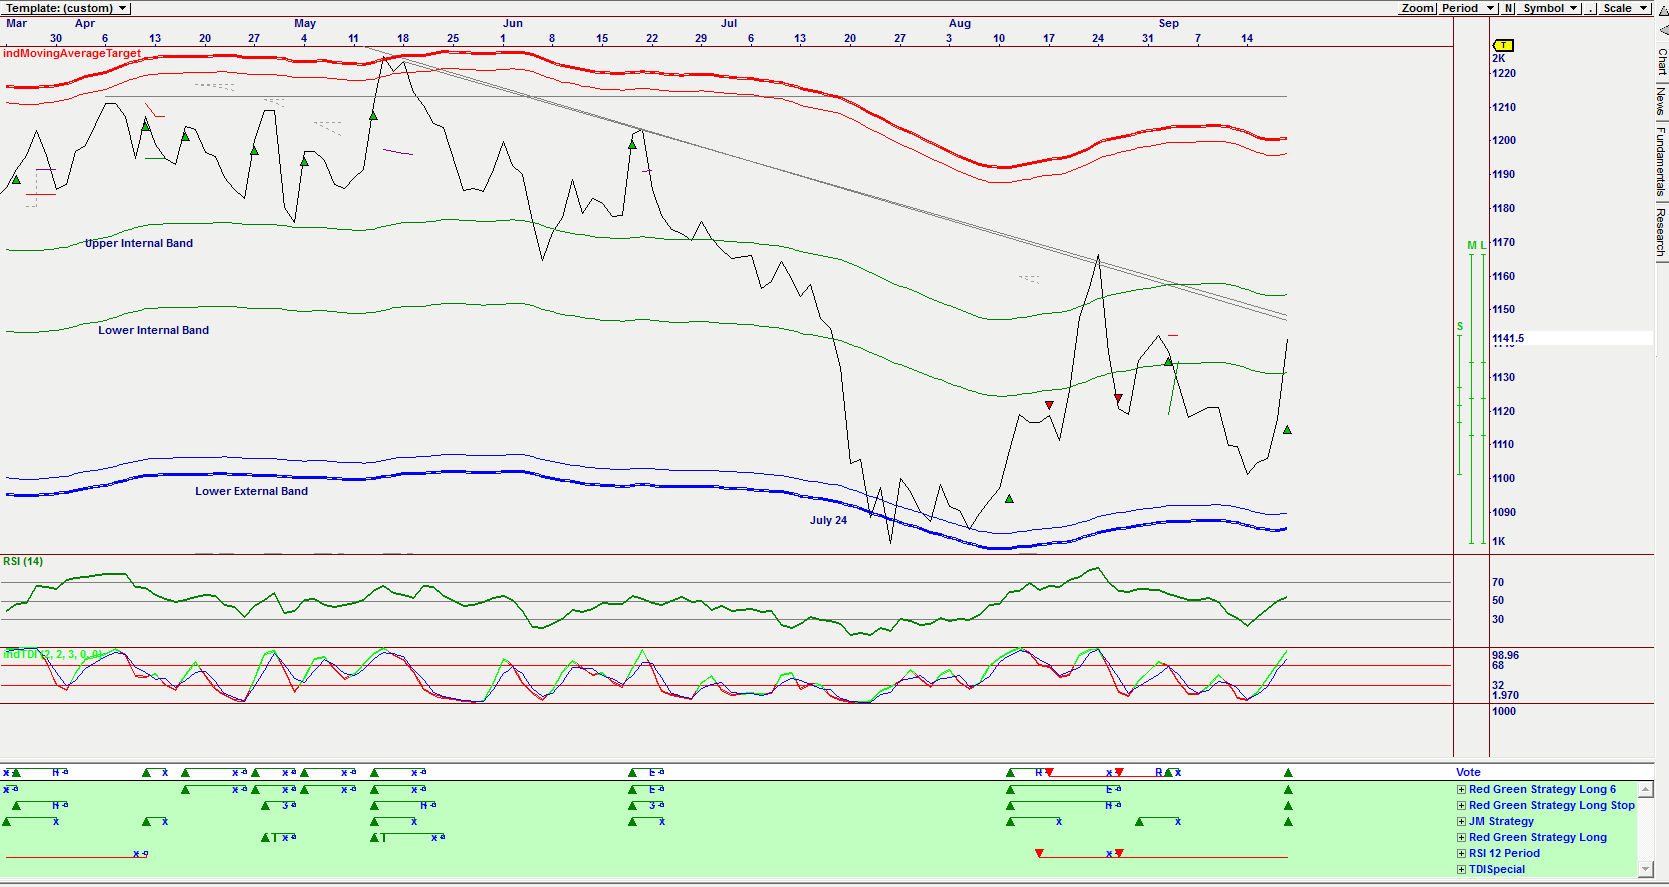
| Figure 3. Daily Omnitrader chart. |
| Graphic provided by: Omnitrader. |
| |
| The chart in Figure 3 is an Omnitrader chart which has given a BUY signal. The ADVISOR rating shown in Figure 4 is at 32, which is low. All the other BUY signals shown on the chart also had an Advisor rating of 32 and one can see how the BUY signals failed. However, with the London Gold price bouncing off the lower external band on July 24th, rising to the upper internal band then falling below the lower internal band and with the RSI and TDI indicators shown on the chart giving buy signals, the possibility of a rise in the gold price could occur. |
|
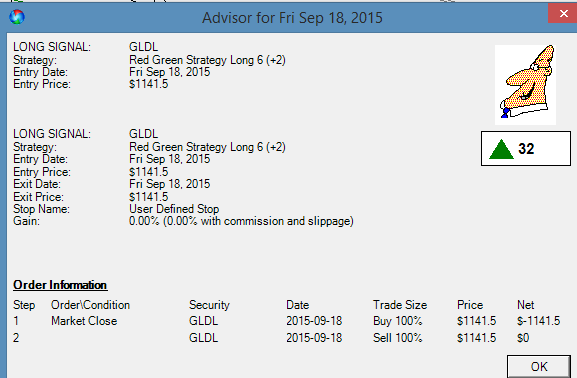
| Figure 4. Advisor Rating. The Advisor rating is currently at 32, meaning the buy signals are not particularly strong. |
| Graphic provided by: Omnitrader. |
| |
| With world uncertainty, looking for an investment safe haven is a must. My charts however are telling me that although gold appears to be bottoming, it is not yet time to invest in gold. Analyzing and keeping an eye on Gold ETF's, though, is a must. One could start nibbling if and when one is overly nervous about the world economy. |
Has been a technical analyst since 1969, and has worked as a futures and options trader with First Financial Futures in Johannesburg, South Africa.
| Address: | 3256 West 24th Ave |
| Vancouver, BC | |
| Phone # for sales: | 6042634214 |
| E-mail address: | petroosp@gmail.com |
Click here for more information about our publications!
Comments

Request Information From Our Sponsors
- StockCharts.com, Inc.
- Candle Patterns
- Candlestick Charting Explained
- Intermarket Technical Analysis
- John Murphy on Chart Analysis
- John Murphy's Chart Pattern Recognition
- John Murphy's Market Message
- MurphyExplainsMarketAnalysis-Intermarket Analysis
- MurphyExplainsMarketAnalysis-Visual Analysis
- StockCharts.com
- Technical Analysis of the Financial Markets
- The Visual Investor
- VectorVest, Inc.
- Executive Premier Workshop
- One-Day Options Course
- OptionsPro
- Retirement Income Workshop
- Sure-Fire Trading Systems (VectorVest, Inc.)
- Trading as a Business Workshop
- VectorVest 7 EOD
- VectorVest 7 RealTime/IntraDay
- VectorVest AutoTester
- VectorVest Educational Services
- VectorVest OnLine
- VectorVest Options Analyzer
- VectorVest ProGraphics v6.0
- VectorVest ProTrader 7
- VectorVest RealTime Derby Tool
- VectorVest Simulator
- VectorVest Variator
- VectorVest Watchdog