HOT TOPICS LIST
- MACD
- Fibonacci
- RSI
- Gann
- ADXR
- Stochastics
- Volume
- Triangles
- Futures
- Cycles
- Volatility
- ZIGZAG
- MESA
- Retracement
- Aroon
INDICATORS LIST
LIST OF TOPICS
PRINT THIS ARTICLE
by Koos van der Merwe
Gilead Sciences, Inc. (GILD) President and COO John Milligan sold 100,000 shares for $10.3 million on September 8, 2015. What does that suggest?
Position: Buy
Koos van der Merwe
Has been a technical analyst since 1969, and has worked as a futures and options trader with First Financial Futures in Johannesburg, South Africa.
PRINT THIS ARTICLE
TECHNICAL ANALYSIS
Gilead Sciences, Inc.
09/17/15 02:20:16 PMby Koos van der Merwe
Gilead Sciences, Inc. (GILD) President and COO John Milligan sold 100,000 shares for $10.3 million on September 8, 2015. What does that suggest?
Position: Buy
| When an insider sells shares they own, the stock price usually drops, and on September 9, 2015 the share price did drop, but on September 10, 2015 and September 11, 2015 the share price rose. Is this a share you could invest in? GILD is a research-based biopharmaceutical company focused on the discovery, development, and commercialization of innovative medicines. On September 12, 2015 the stock price was up 3.3% after the company announced the successful pricing of its senior note offering worth $10 billion in aggregate principal amount. The company was offering six tranches of senior notes maturing between 2018 and 2046 with interest rate ascending from 1.85% to 4.75%. The offering closed on September 14, 2015, subject to the satisfaction of customary closing conditions. The company intends to use the net proceeds from the senior notes offering for general corporate purposes including the repayment of debt, working capital, payment of dividends, and the repurchase of its outstanding common stock pursuant to its authorized share repurchase program. |

|
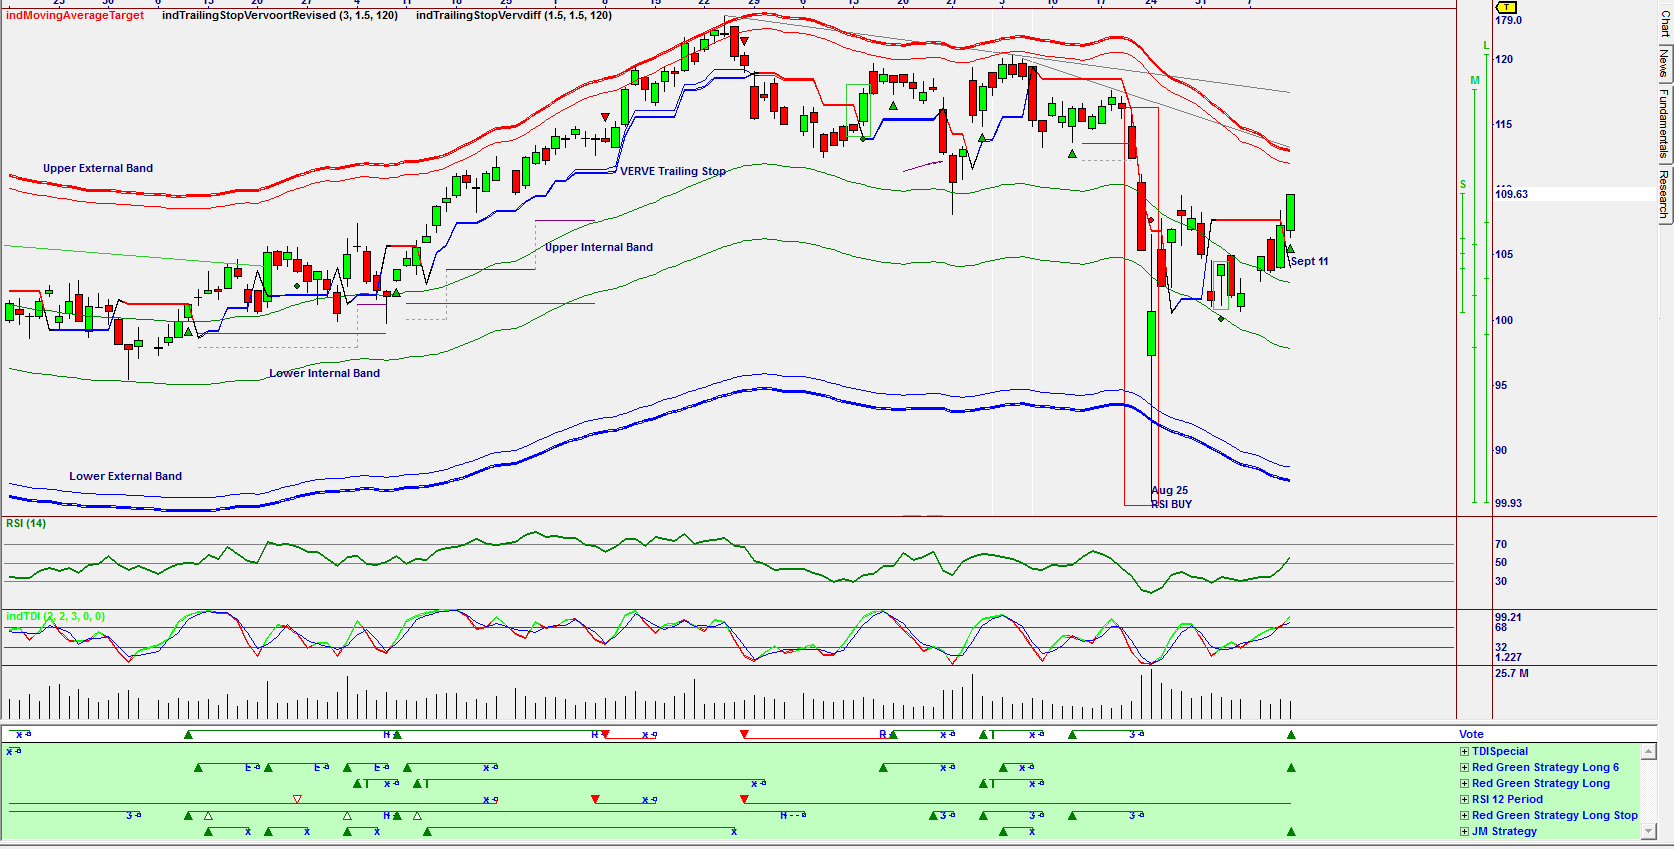
| Figure 1. Buy Signal. A guy signal was given on September 11, 2015. The stock price bounced off the lower external band, found resistance at the upper internal band, then support on the lower internal band, and rose strongly. |
| Graphic provided by: Omnitrader. |
| |
| The chart in Figure 1 is an Omnitrader chart showing a buy signal given on September 11, 2015 based on the JM Strategy and Red Green Strategy Long 6 shown below the Vote line. Note how the stock price bounced off the lower external band, found resistance at the upper internal band, then support on the lower internal band and rose strongly. Note the relative strength index (RSI) which is rising after giving a buy signal on August 25, 2015. |

|
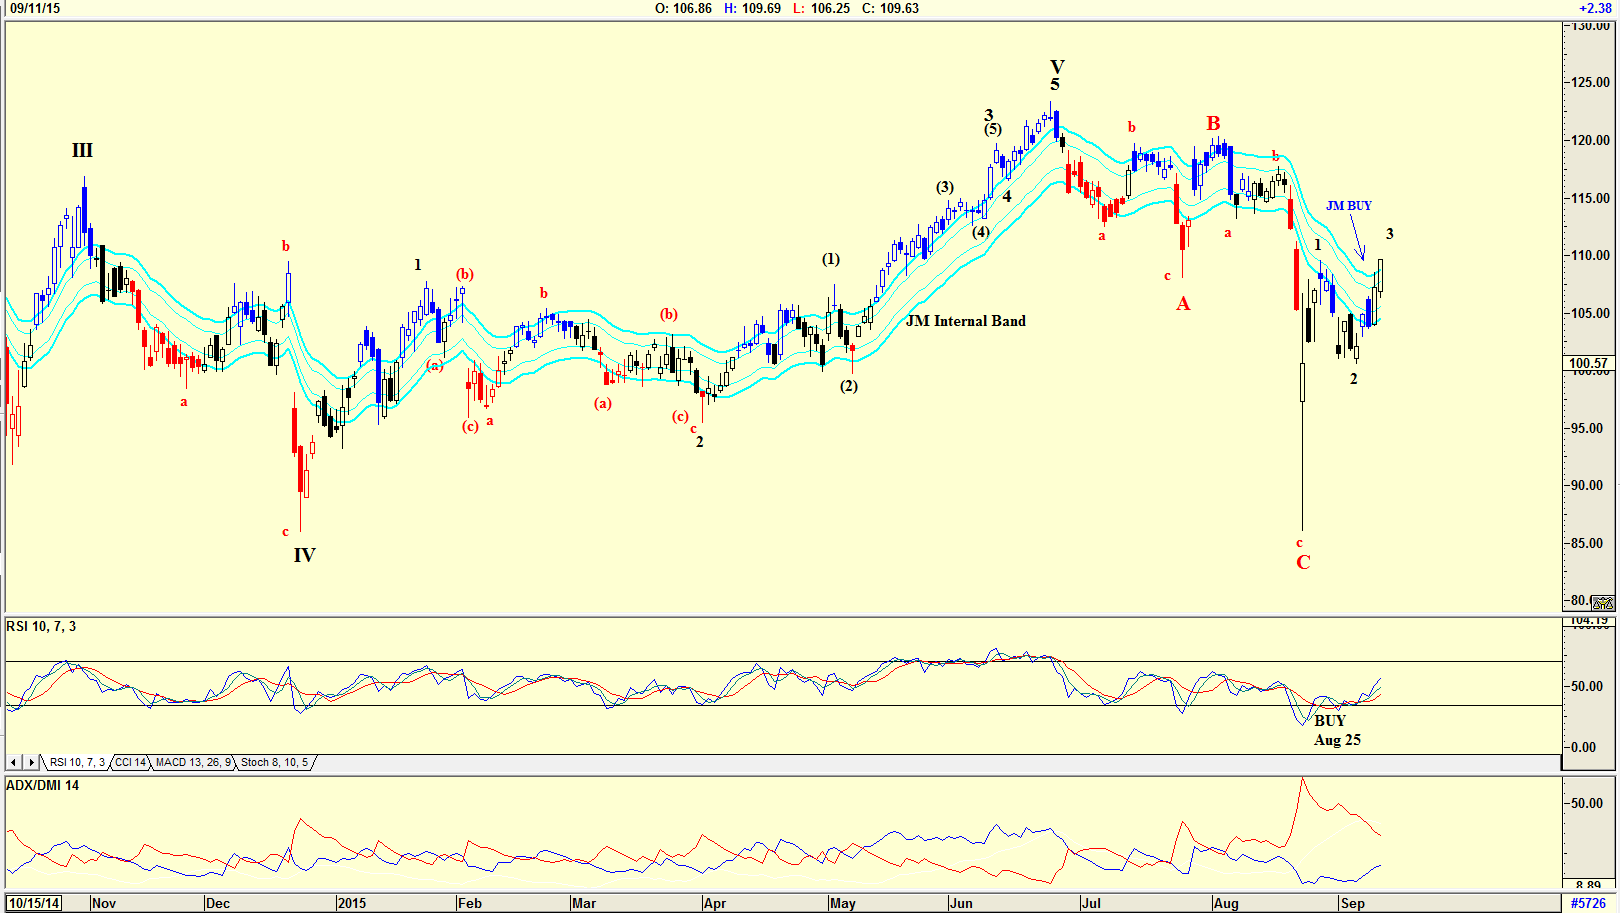
| Figure 2. Daily Chart With Elliott Wave Count. The price could be in a Wave 3 of a WAVE I. Price has risen above the JM internal band indicator upper band suggesting a buy. |
| Graphic provided by: AdvancedGET. |
| |
| The chart in Figure 2 is a daily chart of GILD with an Elliott wave count suggesting that the stock price could be in a Wave 3 of a WAVE 1. The stock price has risen above the JM internal indicator upper band suggesting a buy. The JM internal indicator is a 15-period simple moving average offset by 2% positive and 2% negative. A rise above the upper band is a buy and below the lower band a sell. Note the RSI buy signal given on August 25, 2015. However, the ADX/DMI indicator has not given a buy signal. |

|
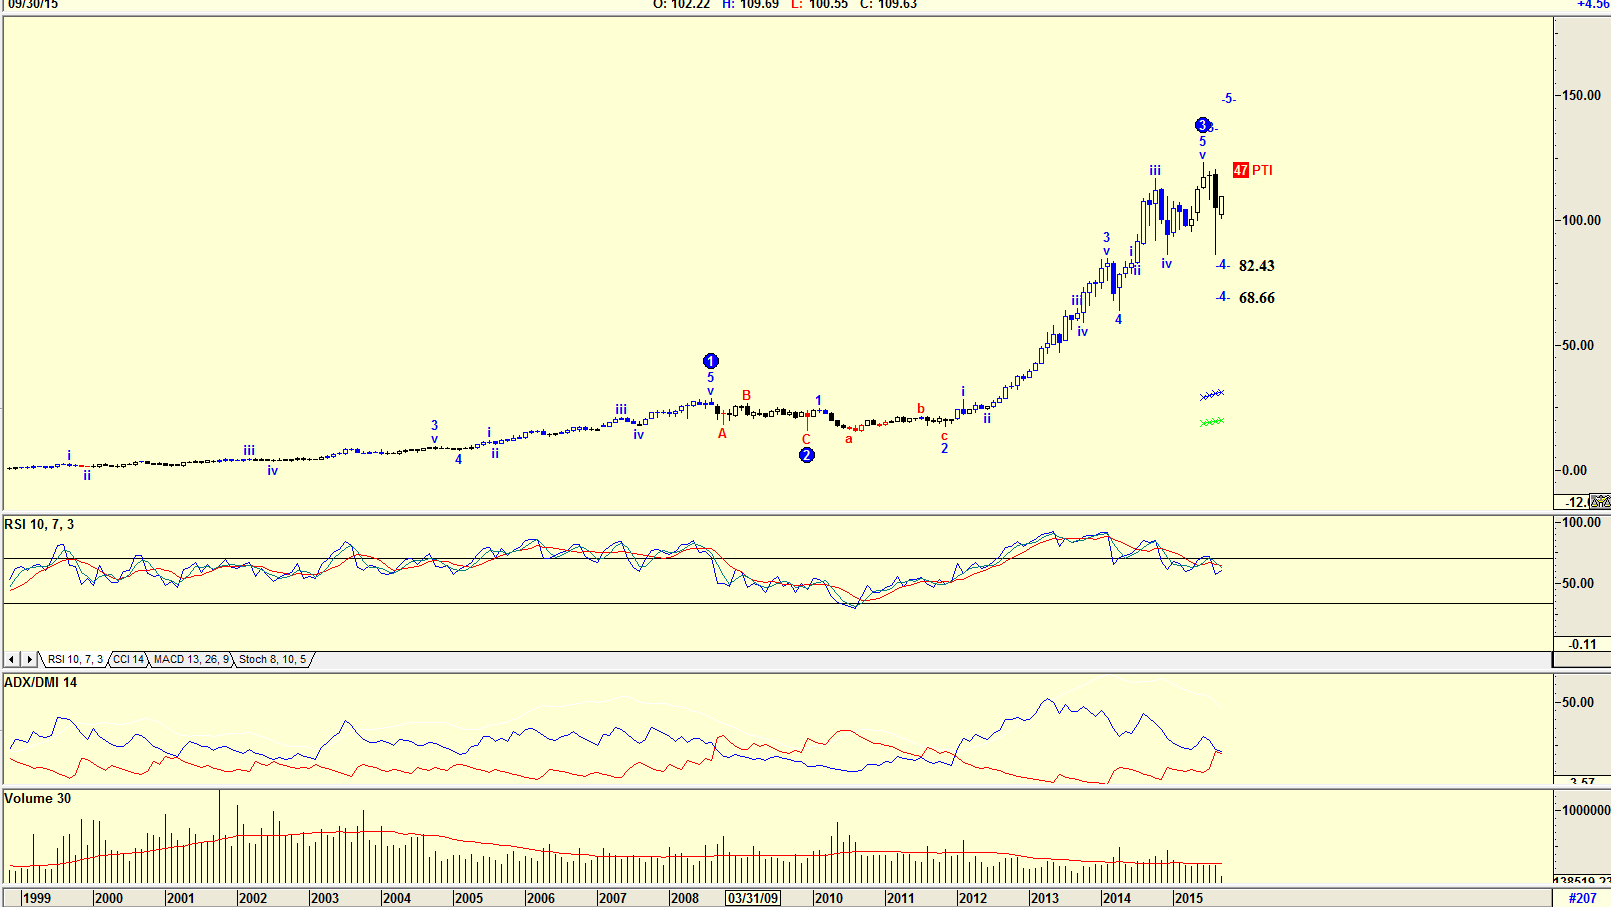
| Figure 3. Monthly Chart With Elliott Wave Count. The price of the stock could fall further in a WAVE 4. the RSI is trending down and the ADX/DMI is close to giving a sell signal. |
| Graphic provided by: AdvancedGET. |
| |
| The chart in Figure 3 is a monthly chart with an Elliott wave count suggesting that the stock price could fall further in a WAVE 4 to either $82.43 or $68.66. The probability index (PTI) is 47 meaning that there is a 47% chance that this could occur. Note the RSI which is trending down and the ADX/DMI indicator which is close to giving a sell. Also note that volume is tapering off as the stock price rose — a sign of weakness. GILD has been receiving a great deal of positive publicity lately, and the stock price has risen as a result. Is it a buy? Yes, simply because it has given a JM internal band buy, but the monthly chart suggests that the stock is not a long-term hold. Traders could buy the share. Investors, however, should be cautious. |
Has been a technical analyst since 1969, and has worked as a futures and options trader with First Financial Futures in Johannesburg, South Africa.
| Address: | 3256 West 24th Ave |
| Vancouver, BC | |
| Phone # for sales: | 6042634214 |
| E-mail address: | petroosp@gmail.com |
Click here for more information about our publications!
Comments
Date: 09/22/15Rank: 5Comment:

Request Information From Our Sponsors
- StockCharts.com, Inc.
- Candle Patterns
- Candlestick Charting Explained
- Intermarket Technical Analysis
- John Murphy on Chart Analysis
- John Murphy's Chart Pattern Recognition
- John Murphy's Market Message
- MurphyExplainsMarketAnalysis-Intermarket Analysis
- MurphyExplainsMarketAnalysis-Visual Analysis
- StockCharts.com
- Technical Analysis of the Financial Markets
- The Visual Investor
- VectorVest, Inc.
- Executive Premier Workshop
- One-Day Options Course
- OptionsPro
- Retirement Income Workshop
- Sure-Fire Trading Systems (VectorVest, Inc.)
- Trading as a Business Workshop
- VectorVest 7 EOD
- VectorVest 7 RealTime/IntraDay
- VectorVest AutoTester
- VectorVest Educational Services
- VectorVest OnLine
- VectorVest Options Analyzer
- VectorVest ProGraphics v6.0
- VectorVest ProTrader 7
- VectorVest RealTime Derby Tool
- VectorVest Simulator
- VectorVest Variator
- VectorVest Watchdog
