HOT TOPICS LIST
- MACD
- Fibonacci
- RSI
- Gann
- ADXR
- Stochastics
- Volume
- Triangles
- Futures
- Cycles
- Volatility
- ZIGZAG
- MESA
- Retracement
- Aroon
INDICATORS LIST
LIST OF TOPICS
PRINT THIS ARTICLE
by Koos van der Merwe
Lululemon Athletica, Inc., known by all, is a self-described yoga-inspired athletic apparel company.
Position: Buy
Koos van der Merwe
Has been a technical analyst since 1969, and has worked as a futures and options trader with First Financial Futures in Johannesburg, South Africa.
PRINT THIS ARTICLE
TECHNICAL ANALYSIS
Another Look At Lululemon
09/09/15 03:04:14 PMby Koos van der Merwe
Lululemon Athletica, Inc., known by all, is a self-described yoga-inspired athletic apparel company.
Position: Buy
| The company is well known, producing a clothing line loved by many. Today the company runs international clothing stores from its company base in Vancouver, British Columbia, Canada. On the 3rd of September 2015, the company announced that it will be presenting at the Stifel 2015 Consumer Conference held at the New York Palace Hotel in New York City on Thursday, September 17th. So, is it worth buying shares in the company ahead of a show? With the recent correction in the market, shares of Lululemon corrected as well. Is it now time to start buying the share? |

|
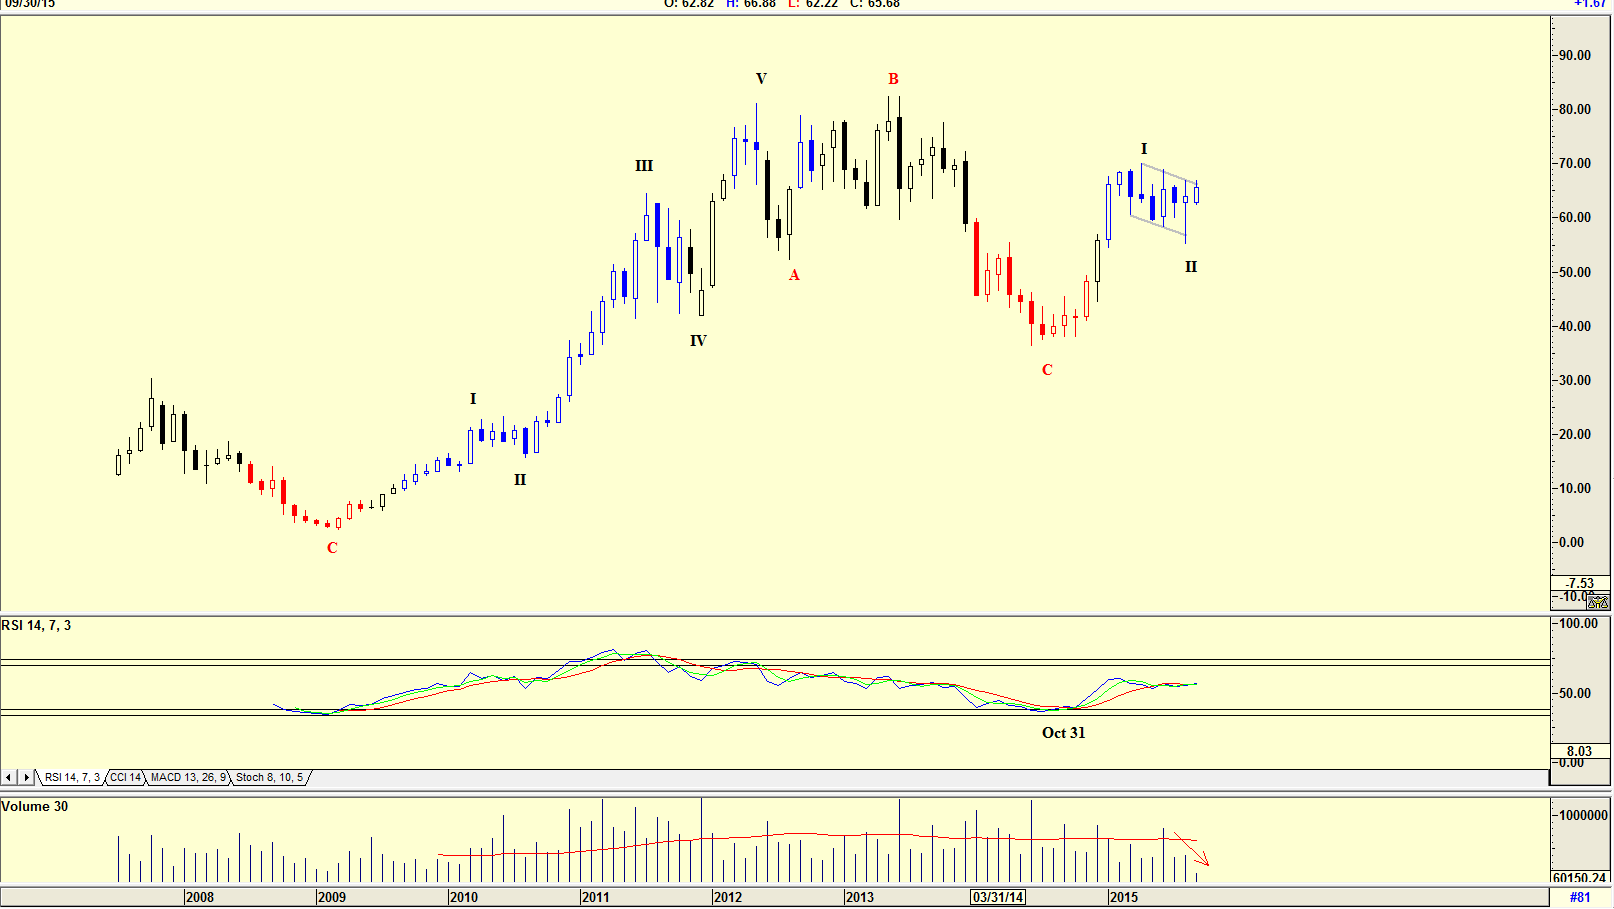
| Figure 1. A monthly chart of LULU with an Elliott wave count. |
| Graphic provided by: AdvancedGET. |
| |
| The chart in Figure 1 is a monthly chart with an Elliott wave count suggesting that the share price has probably completed a WAVE II and could now be moving into a WAVE III of a fresh bull trend. The RSI indicator is positive, suggesting strength having given a buy signal on October 31st, when the share price bottomed in a C-Wave. Take note of the fall in volume as the share price recently fell, a sign of strength. |

|
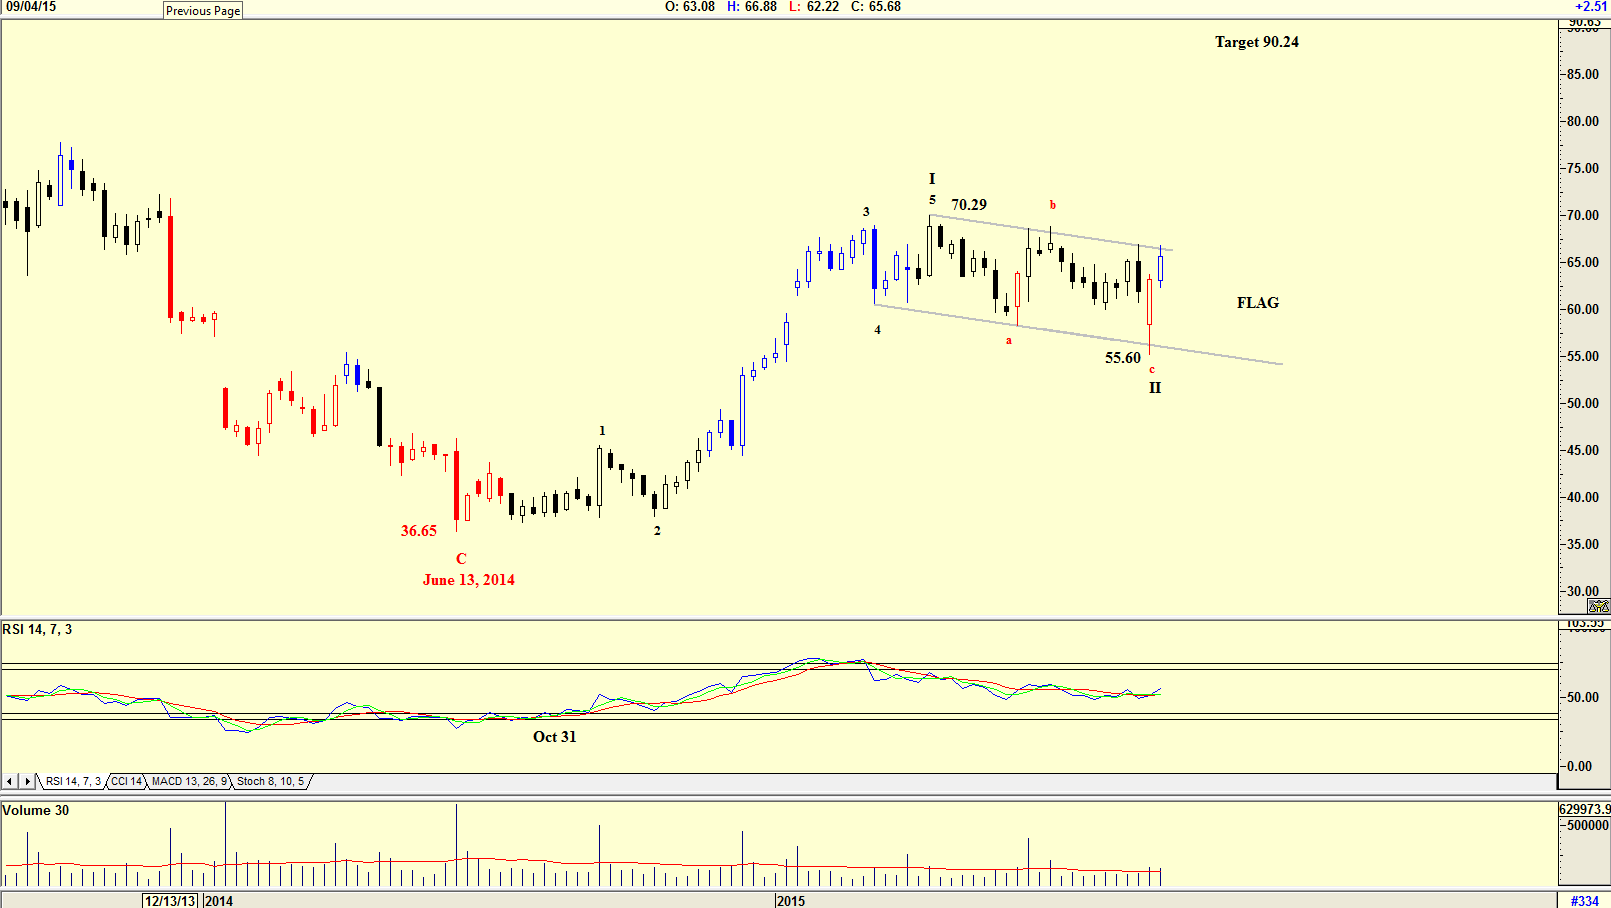
| Figure 2. A weekly chart of LULU showing a flag pattern with the target price of $90.24. |
| Graphic provided by: AdvancedGET. |
| |
| The chart in Figure 2 is a weekly chart showing the flag pattern that has developed. A flag pattern is a true consolidation pattern and a very reliable indicator both in terms of direction and target measurement. In an up market, flags usually form after a dynamic nearly straight move up. The target suggested by the flag pattern is $90.24. (70.29-36.65=33.64+56.60=90.24.) |

|
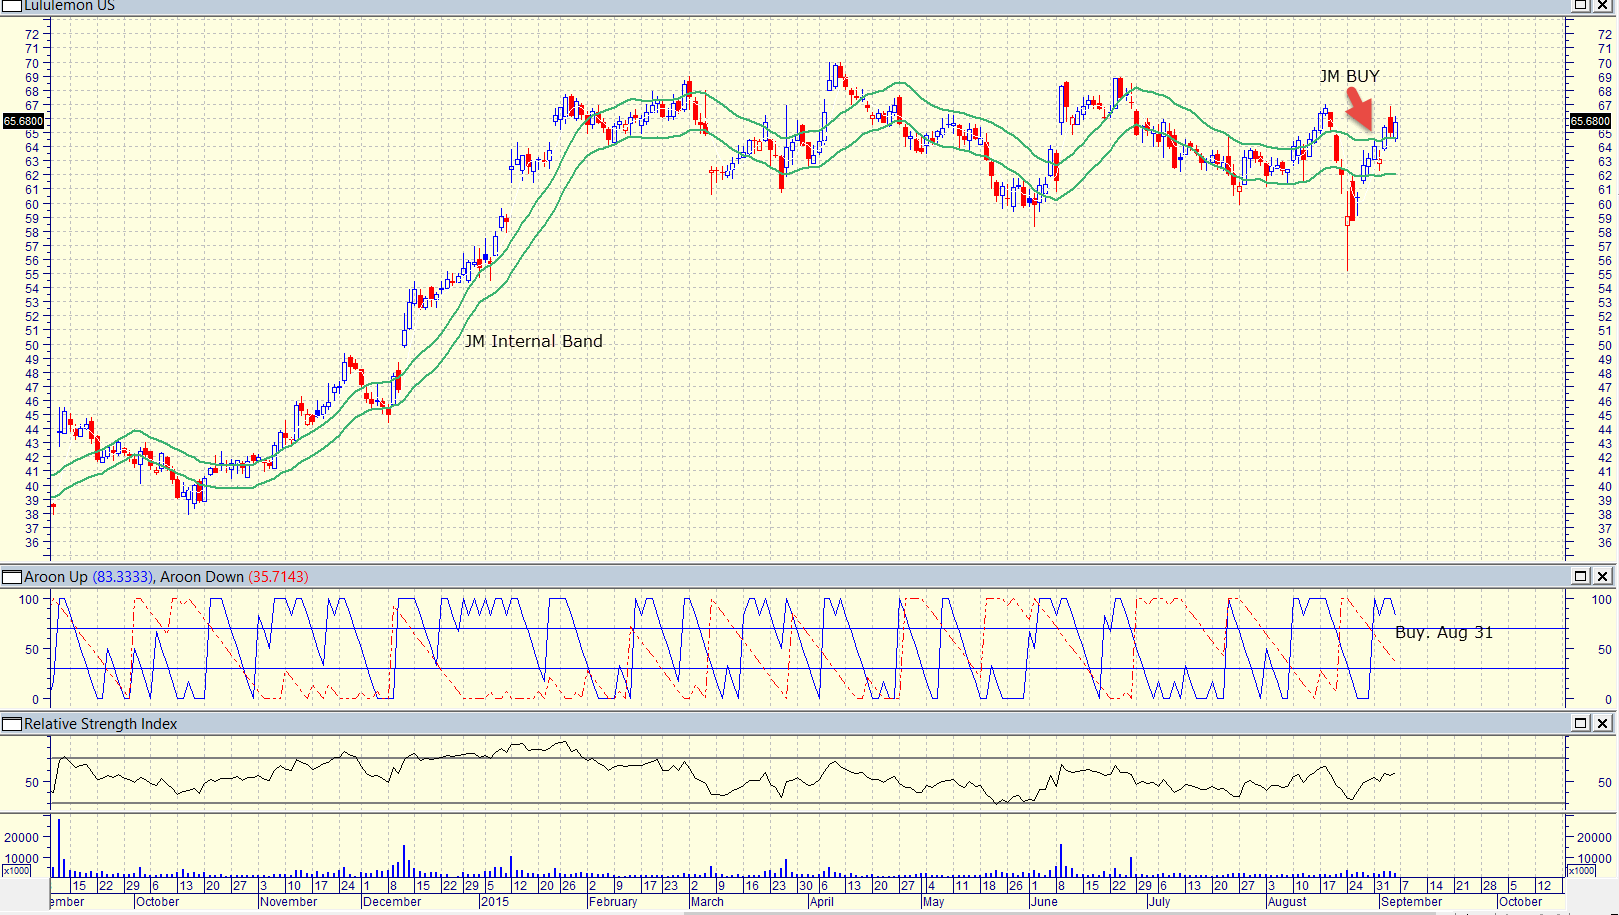
| Figure 3. A daily chart of LULU showing three different indicators suggesting a buy. |
| Graphic provided by: MetaStock. |
| |
| The chart in Figure 3 is a daily chart showing a JM internal band buy signal. This buy signal was confirmed by the buy signal given by the Aroon indicator on August 31st. The JM internal band is a simple 15 period moving average offset by 2% positive and 2% negative. With the market looking as if it could start rising after a strong correction, Lululemon shares look very tempting as a buy, especially with indicators also suggesting a buy. |
Has been a technical analyst since 1969, and has worked as a futures and options trader with First Financial Futures in Johannesburg, South Africa.
| Address: | 3256 West 24th Ave |
| Vancouver, BC | |
| Phone # for sales: | 6042634214 |
| E-mail address: | petroosp@gmail.com |
Click here for more information about our publications!
Comments

Request Information From Our Sponsors
- StockCharts.com, Inc.
- Candle Patterns
- Candlestick Charting Explained
- Intermarket Technical Analysis
- John Murphy on Chart Analysis
- John Murphy's Chart Pattern Recognition
- John Murphy's Market Message
- MurphyExplainsMarketAnalysis-Intermarket Analysis
- MurphyExplainsMarketAnalysis-Visual Analysis
- StockCharts.com
- Technical Analysis of the Financial Markets
- The Visual Investor
- VectorVest, Inc.
- Executive Premier Workshop
- One-Day Options Course
- OptionsPro
- Retirement Income Workshop
- Sure-Fire Trading Systems (VectorVest, Inc.)
- Trading as a Business Workshop
- VectorVest 7 EOD
- VectorVest 7 RealTime/IntraDay
- VectorVest AutoTester
- VectorVest Educational Services
- VectorVest OnLine
- VectorVest Options Analyzer
- VectorVest ProGraphics v6.0
- VectorVest ProTrader 7
- VectorVest RealTime Derby Tool
- VectorVest Simulator
- VectorVest Variator
- VectorVest Watchdog
