HOT TOPICS LIST
- MACD
- Fibonacci
- RSI
- Gann
- ADXR
- Stochastics
- Volume
- Triangles
- Futures
- Cycles
- Volatility
- ZIGZAG
- MESA
- Retracement
- Aroon
INDICATORS LIST
LIST OF TOPICS
PRINT THIS ARTICLE
by Koos van der Merwe
With the extreme volatility we have seen in the stock market over the past two weeks, finding guidance is calming.
Position: Accumulate
Koos van der Merwe
Has been a technical analyst since 1969, and has worked as a futures and options trader with First Financial Futures in Johannesburg, South Africa.
PRINT THIS ARTICLE
TECHNICAL INDICATORS
Looking For Guidance
09/01/15 03:19:36 PMby Koos van der Merwe
With the extreme volatility we have seen in the stock market over the past two weeks, finding guidance is calming.
Position: Accumulate
| The indexes have moved strongly in either direction over the past two weeks with extreme volatility. The question, "whither goest thou?" has been on everyone's mind. Looking for guidance as to what to expect for the future becomes necessary. One stock you can look at for help in making a decision is Berkshire Hathaway B (BRK.B). We all respect the investment decisions made by Warren Buffett. Following the movement of his investment companies can only be an advantage. |

|
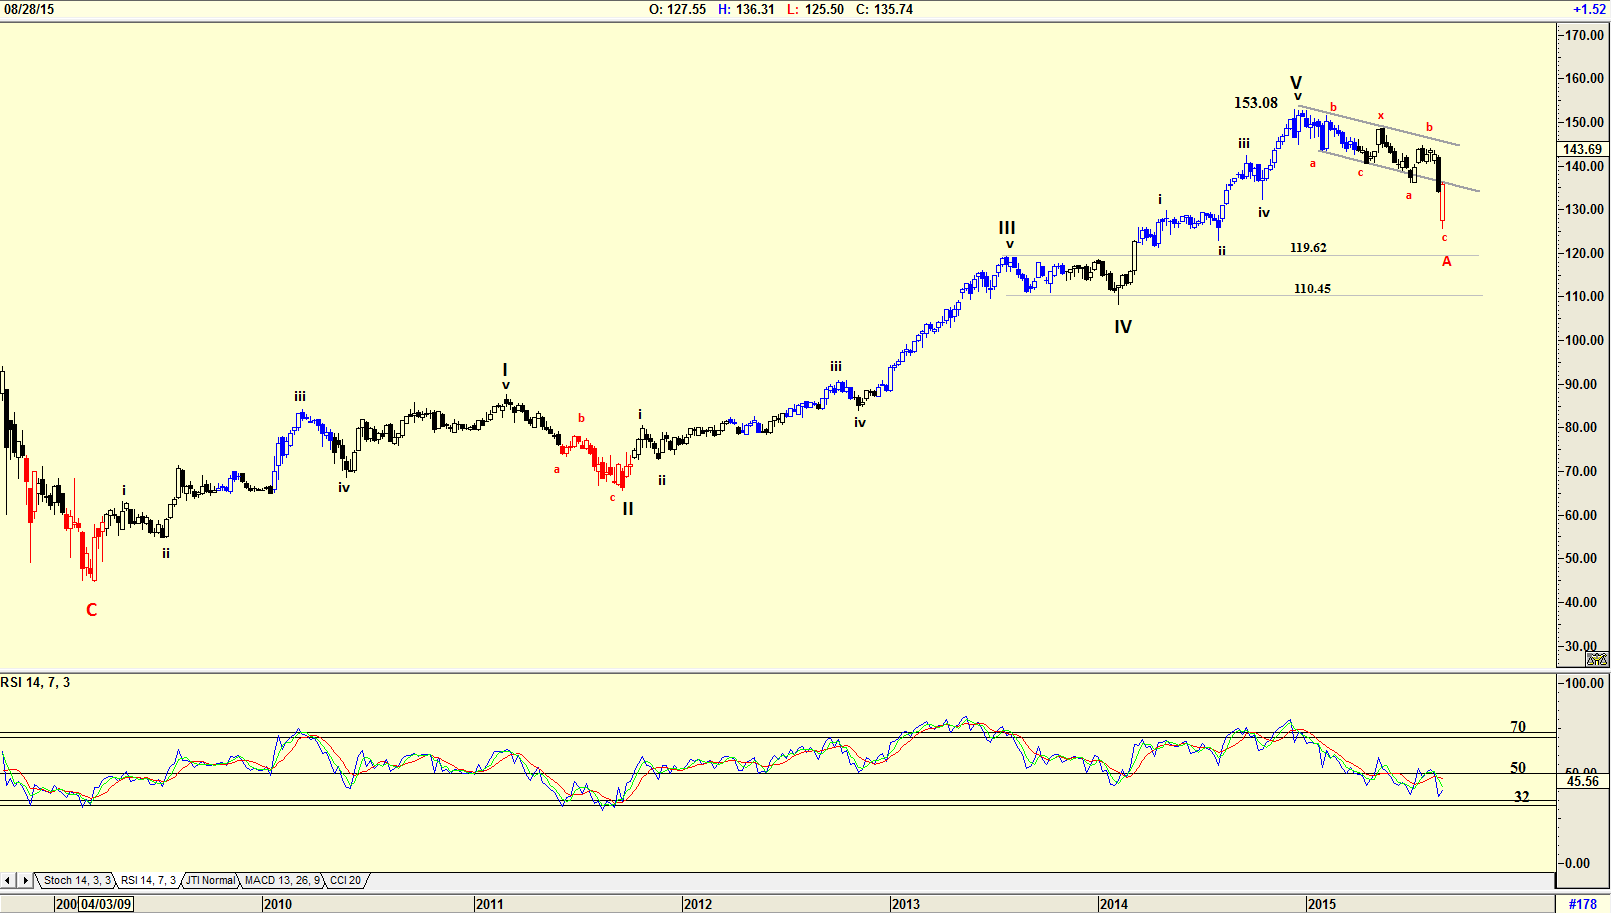
| Figure 1. Weekly Chart Of Berkshire Hathaway B Stock. The Elliott wave count suggests that the ABC correction may not be over. |
| Graphic provided by: AdvancedGET. |
| |
| The chart in Figure 1 is a weekly chart of BRK.B shares, with an Elliott wave count that is suggesting that the ABC correction may not be over. The correction should end in the fourth wave of lesser degree, which means that it should fall to somewhere between $110.45 and $119.62. The relative strength index (RSI) is still trending down, confirming this. An RSI usually suggests a buy when it falls below the 32 horizontal line and then moves above it. Do note, however, how often the indicator flirted with the 50 horizontal line, and the share price moved up. The share price should now correct upward in a B wave. However, you should never forget that an Elliott wave has become a signpost in the wilderness, and can change its count a little way down the road. This suggests that should the price move above the high of Wave V at $153.08, it means that the share price could be in a new Wave I. Uncertainty therefore always exists. So, with the chart of Figure 1 suggesting that a rise into a B-Wave could occur, traders could look to buy shares, keeping stops close. |

|
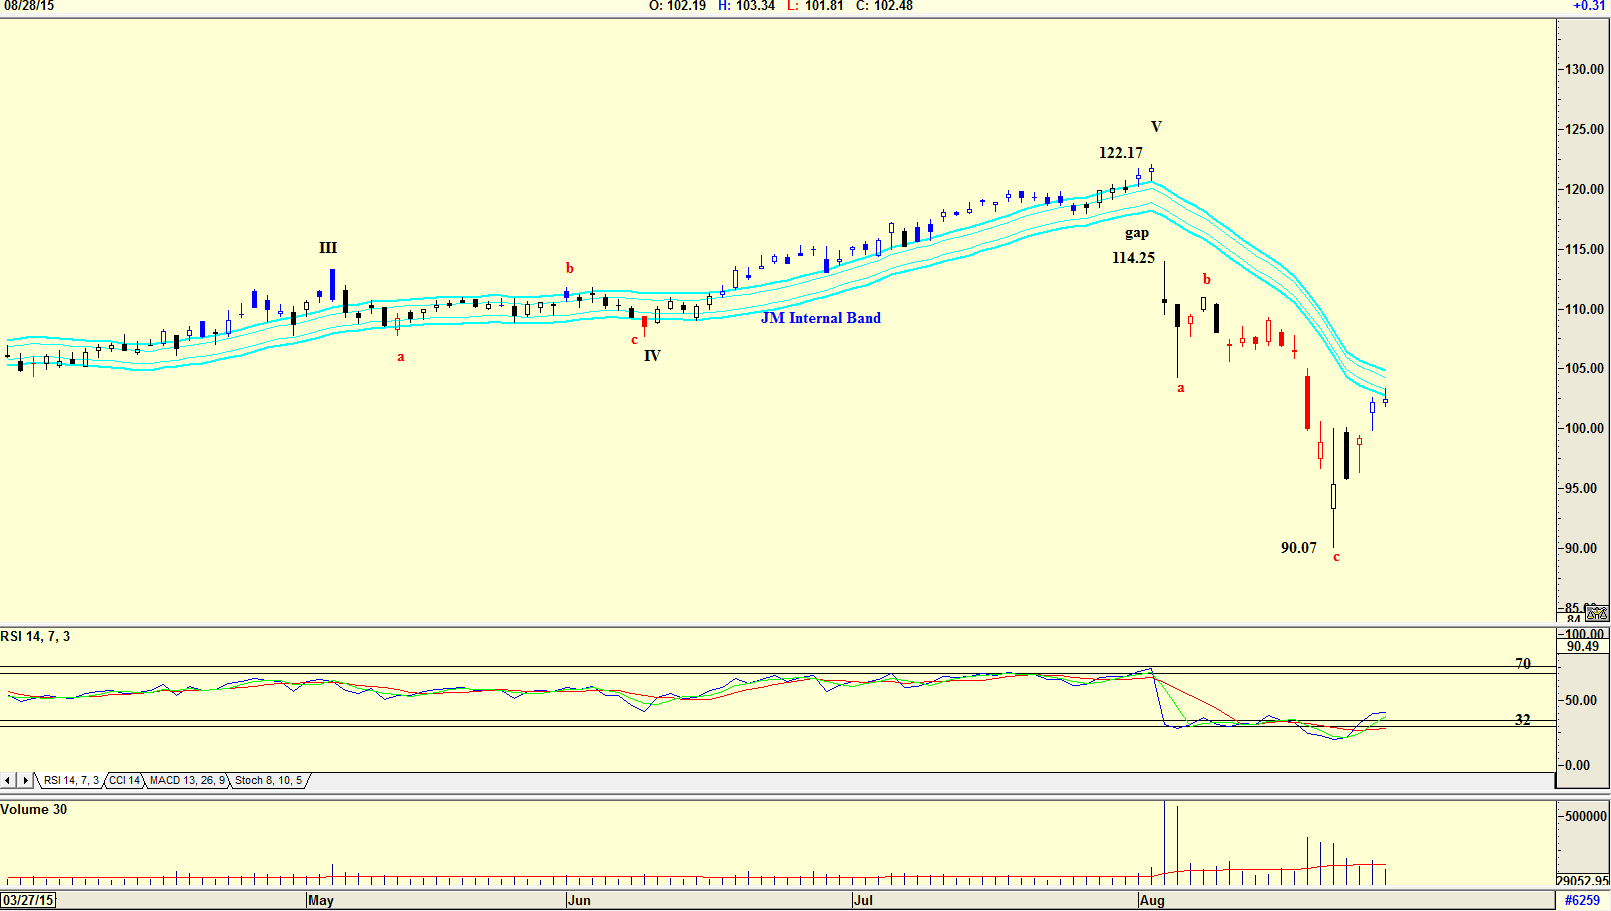
| Figure 2. Daily Chart Of The Walt Disney Company Stock. The stock price could have bottomed at $90.07. The RSI has also given a buy signal. |
| Graphic provided by: AdvancedGET. |
| |
| One share that has captured my attention is that of the Walt Disney Company (DIS). The share fell heavily on results that were not up to market expectations, and appears to have bottomed at $90.07 (Figure 2). The RSI has also given a buy, falling below the 32 horizontal and then rising above it. The share also fell on a gap, and often times, the price of a stock tends to rise to fill a gap. Volume was high when the share fell, and weakened as the share price rose, which is not a sign of strength. Because of this, rather than buy shares now, I would wait for it to move above the upper JM internal band. A JM internal band is a 15-period simple moving average offset by 2% positive and 2% negative. A move above the upper band suggests a buy, and below the lower band suggests a sell. |

|
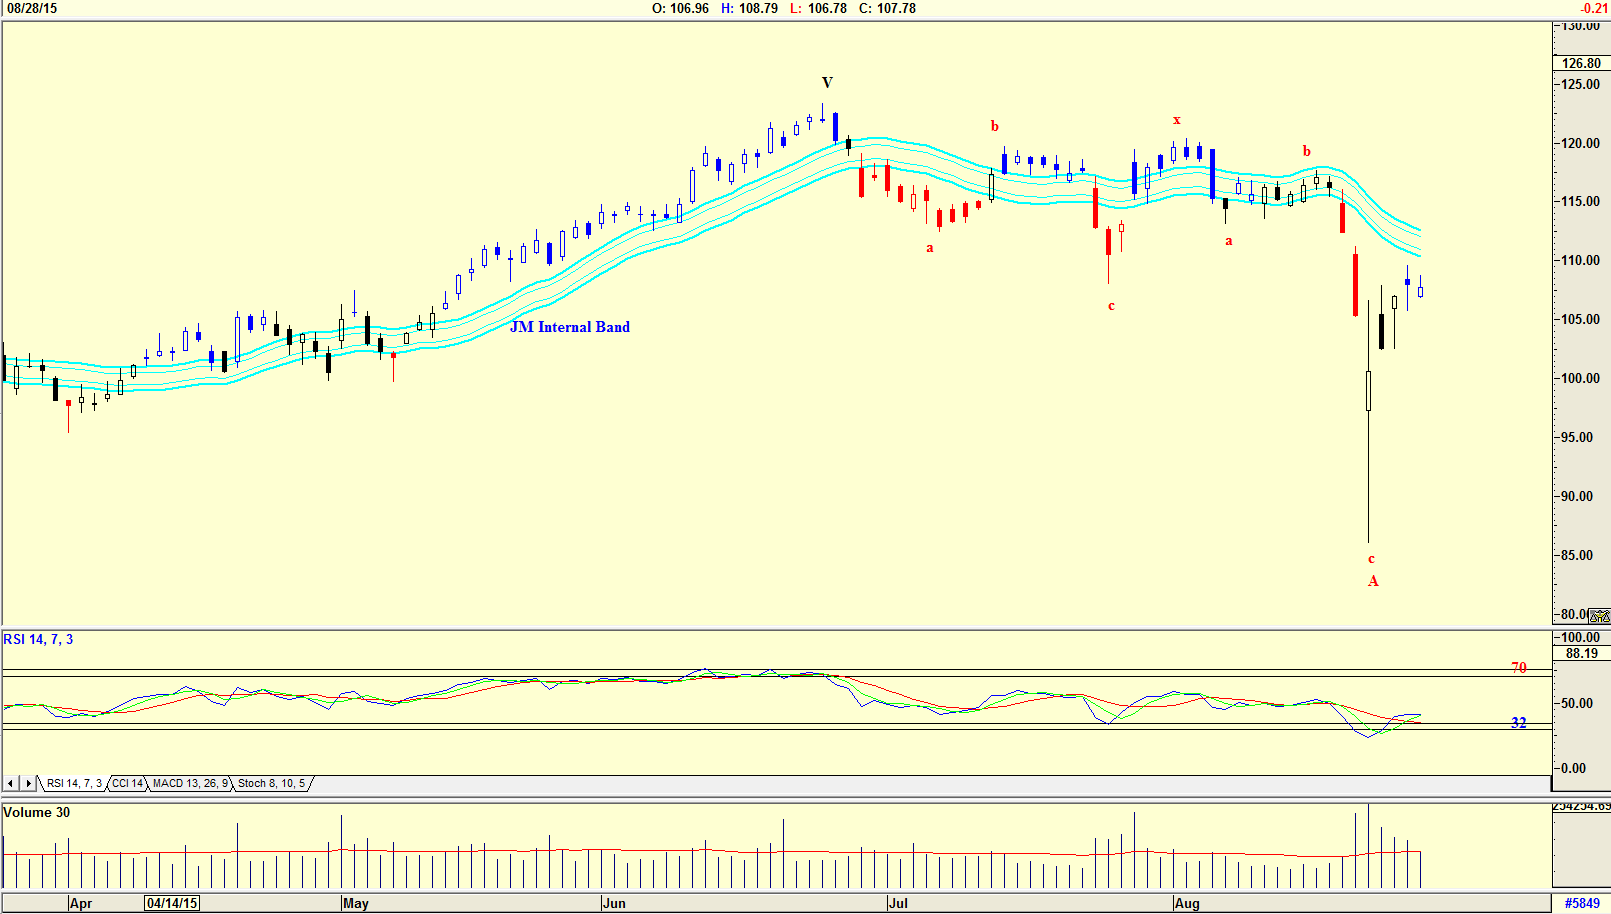
| Figure 3. Daily Chart Of Giliead Sciences. The RSI suggested a buy after which the stock price rose. However, volume fell as stock price rose, which suggests weakness. |
| Graphic provided by: AdvancedGET. |
| |
| Another share that has captured my interest is Gilead Sciences Inc. (GILD). Once again the RSI suggested a buy after which the stock price rose (Figure 3). However, once again volume fell as the stock price rose, suggesting weakness. Again, I would prefer to wait for the stock price to rise above the upper JM internal band before buying for a long-term investment. As a trader, I would think of buying at the current price. There are several stocks out there at the moment that you could buy because of the recent correction. Stocks of companies such as Starbucks Corp. (SBUX), Netflix, Inc. (NFLX), Facebook, Inc. (FB), Tesla Motors, Inc. (TSLA) are among a few. However, with the present market volatility, you should remain cautious until stability returns. |
Has been a technical analyst since 1969, and has worked as a futures and options trader with First Financial Futures in Johannesburg, South Africa.
| Address: | 3256 West 24th Ave |
| Vancouver, BC | |
| Phone # for sales: | 6042634214 |
| E-mail address: | petroosp@gmail.com |
Click here for more information about our publications!
PRINT THIS ARTICLE

Request Information From Our Sponsors
- StockCharts.com, Inc.
- Candle Patterns
- Candlestick Charting Explained
- Intermarket Technical Analysis
- John Murphy on Chart Analysis
- John Murphy's Chart Pattern Recognition
- John Murphy's Market Message
- MurphyExplainsMarketAnalysis-Intermarket Analysis
- MurphyExplainsMarketAnalysis-Visual Analysis
- StockCharts.com
- Technical Analysis of the Financial Markets
- The Visual Investor
- VectorVest, Inc.
- Executive Premier Workshop
- One-Day Options Course
- OptionsPro
- Retirement Income Workshop
- Sure-Fire Trading Systems (VectorVest, Inc.)
- Trading as a Business Workshop
- VectorVest 7 EOD
- VectorVest 7 RealTime/IntraDay
- VectorVest AutoTester
- VectorVest Educational Services
- VectorVest OnLine
- VectorVest Options Analyzer
- VectorVest ProGraphics v6.0
- VectorVest ProTrader 7
- VectorVest RealTime Derby Tool
- VectorVest Simulator
- VectorVest Variator
- VectorVest Watchdog
