HOT TOPICS LIST
- MACD
- Fibonacci
- RSI
- Gann
- ADXR
- Stochastics
- Volume
- Triangles
- Futures
- Cycles
- Volatility
- ZIGZAG
- MESA
- Retracement
- Aroon
INDICATORS LIST
LIST OF TOPICS
PRINT THIS ARTICLE
by Kevin Hopson
December natural gas (NGZ2) has seen a sharp sell off over the last few weeks, as weakness in the crude oil futures market has weighed on prices. However, the contract successfully tested key long-term support in the $3.72 to $3.76 range last week.
Position: Buy
Kevin Hopson
Kevin has been a technical analyst for roughly 10 years now. Previously, Kevin owned his own business and acted as a registered investment advisor, specializing in energy. He was also a freelance oil analyst for Orient Trading Co., a commodity futures trading firm in Japan. Kevin is currently a freelance writer.
PRINT THIS ARTICLE
TECHNICAL ANALYSIS
December Natural Gas Bounces Off Long-Term Support
11/18/02 11:37:35 AMby Kevin Hopson
December natural gas (NGZ2) has seen a sharp sell off over the last few weeks, as weakness in the crude oil futures market has weighed on prices. However, the contract successfully tested key long-term support in the $3.72 to $3.76 range last week.
Position: Buy
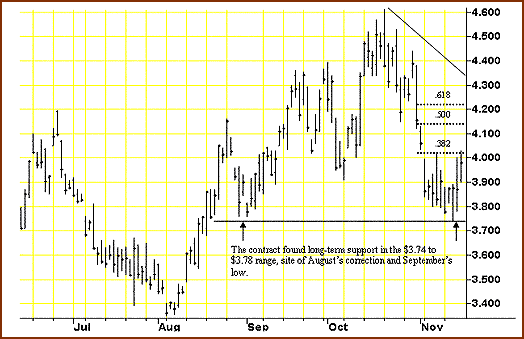
| As you can see in the chart below, the $3.72 to $3.76 range is the site of August's correction and September's low. Coupled with the contract's 200-day moving average, which currently resides at $3.81, this area of support was considered significant. |
| As chance would have it, December natural gas successfully bounced off support here last week and has now broken to the upside. More specifically, the contract broke a double top in the $3.94 to $3.96 range last Friday, giving a short-term buy signal in the process. Though December natural gas bounced off the 38.2 percent retracement level ($4.03) from October's high to November's low last Friday, this was labeled as minor resistance, the reason being that there were no other technical resistance points close to this price level. |

|
| Graphic provided by: SuperCharts. |
| |
| Being the case, it was no surprise to see December natural gas rally on Monday, as the contract easily overcame the 38.2 percent retracement level from the October-November sell off. If December natural gas can close above the $4.12 level, site of the 50 percent retracement from the October-November sell off and the contract's 50-day moving average, this would be very bullish. Additionally, a break of key resistance at the $4.21 level, site of the 61.8 percent retracement, could lead to a longer-term price target of $4.34. This is currently the site of the contract's downtrend line from October's high. |
Kevin has been a technical analyst for roughly 10 years now. Previously, Kevin owned his own business and acted as a registered investment advisor, specializing in energy. He was also a freelance oil analyst for Orient Trading Co., a commodity futures trading firm in Japan. Kevin is currently a freelance writer.
| Glen Allen, VA | |
| E-mail address: | hopson_1@yahoo.com |
Click here for more information about our publications!
PRINT THIS ARTICLE

Request Information From Our Sponsors
- StockCharts.com, Inc.
- Candle Patterns
- Candlestick Charting Explained
- Intermarket Technical Analysis
- John Murphy on Chart Analysis
- John Murphy's Chart Pattern Recognition
- John Murphy's Market Message
- MurphyExplainsMarketAnalysis-Intermarket Analysis
- MurphyExplainsMarketAnalysis-Visual Analysis
- StockCharts.com
- Technical Analysis of the Financial Markets
- The Visual Investor
- VectorVest, Inc.
- Executive Premier Workshop
- One-Day Options Course
- OptionsPro
- Retirement Income Workshop
- Sure-Fire Trading Systems (VectorVest, Inc.)
- Trading as a Business Workshop
- VectorVest 7 EOD
- VectorVest 7 RealTime/IntraDay
- VectorVest AutoTester
- VectorVest Educational Services
- VectorVest OnLine
- VectorVest Options Analyzer
- VectorVest ProGraphics v6.0
- VectorVest ProTrader 7
- VectorVest RealTime Derby Tool
- VectorVest Simulator
- VectorVest Variator
- VectorVest Watchdog
