HOT TOPICS LIST
- MACD
- Fibonacci
- RSI
- Gann
- ADXR
- Stochastics
- Volume
- Triangles
- Futures
- Cycles
- Volatility
- ZIGZAG
- MESA
- Retracement
- Aroon
INDICATORS LIST
LIST OF TOPICS
PRINT THIS ARTICLE
by Koos van der Merwe
In my article, "Where Is The Market Heading?", that appeared in the September 2015 issue of Technical Analysis of Stocks & Commodities (TASC) magazine, I concluded that market and economic patterns will still exist but without doubt they will become a great deal more volatile and complicated.
Position: Accumulate
Koos van der Merwe
Has been a technical analyst since 1969, and has worked as a futures and options trader with First Financial Futures in Johannesburg, South Africa.
PRINT THIS ARTICLE
ELLIOTT WAVE
Is This The Wave IV?
08/24/15 04:14:30 PMby Koos van der Merwe
In my article, "Where Is The Market Heading?", that appeared in the September 2015 issue of Technical Analysis of Stocks & Commodities (TASC) magazine, I concluded that market and economic patterns will still exist but without doubt they will become a great deal more volatile and complicated.
Position: Accumulate
| In the article I also state that analyzing the market today has become much more complicated than when Ralph Nelson Elliott developed his Elliott wave count. To quote from the book Elliott Wave Principle by A.J. Frost and Robert Prechter, "Essentially the Elliott wave principle is a system of empirically derived rules for interpreting action in the stock market averages." Unfortunately my years of research is concluding that with unemotional computers trading the market with complicated algorithms, and trading within seconds, the Elliott wave is becoming more a signpost in the wilderness that can change at the next signpost a little way down the road. |

|
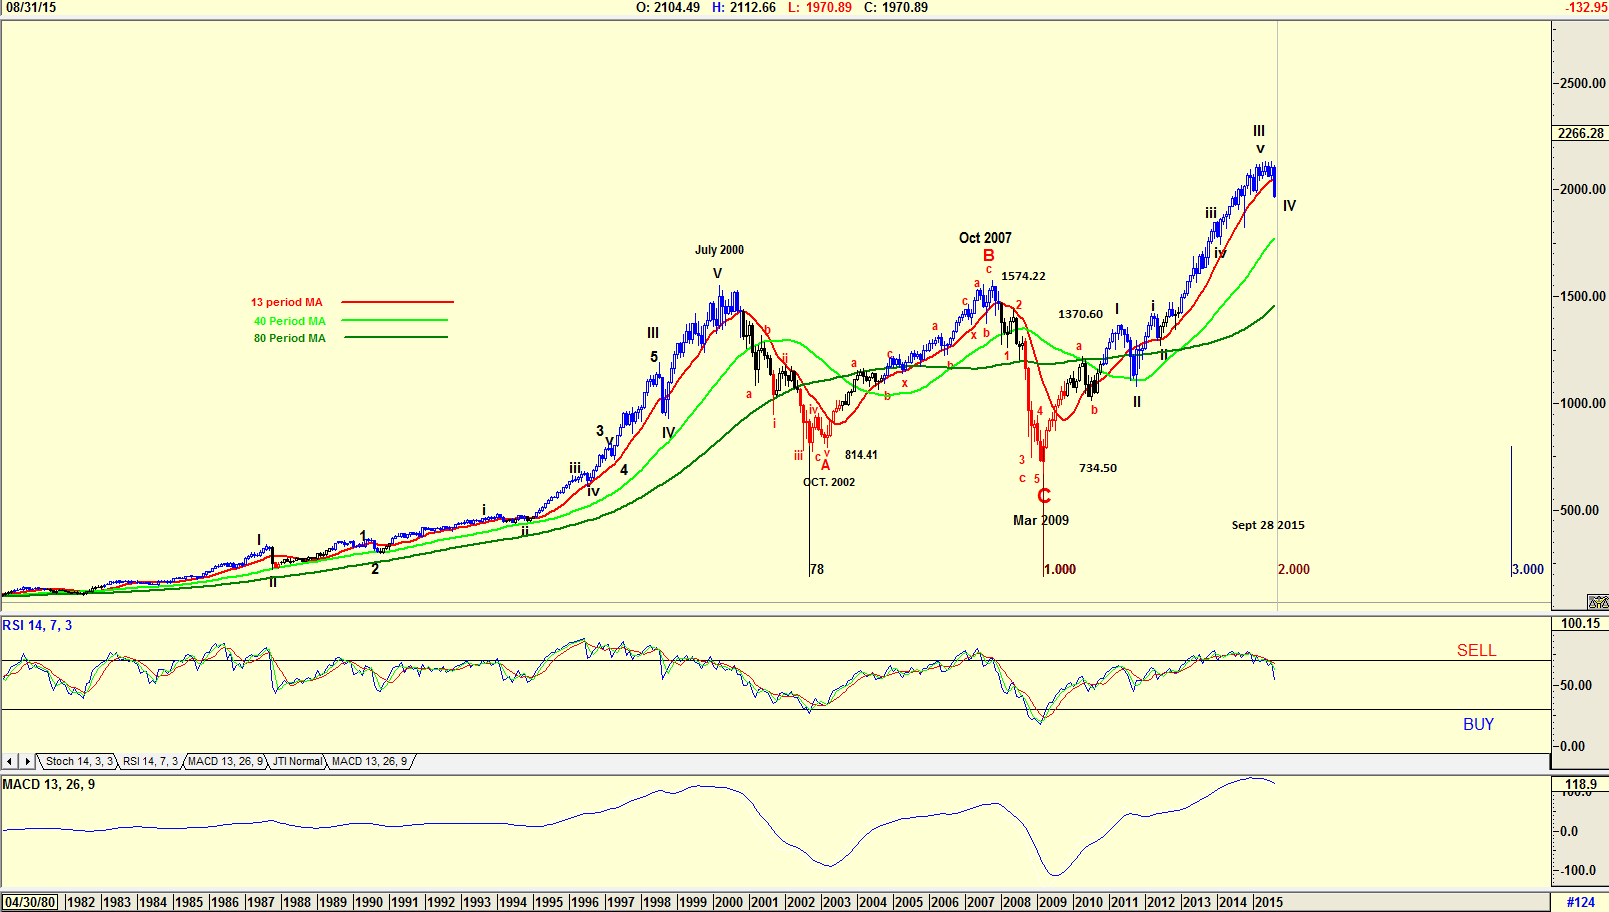
| Figure 1. Monthly Chart Of S&P 500 Index. This chart suggests that the S&P 500 index may have completed a major Wave III and is now tracing a major Wave IV. |
| Graphic provided by: AdvancedGET. |
| |
| My chart in Figure 1 is a monthly chart of the S&P 500 index, from 1982 until August 21, 2015. My Elliott wave count is suggesting that the S&P 500 index has completed a major Wave III and is now tracing a major Wave IV. Because Wave II was a simple correction, straight down with no abc correction, we can now expect Wave IV to be a complicated abc correction. This complicated correction is confirmed by the relative strength index (RSI) and moving average convergence/divergence (MACD) indicators which are trending down. However, the cyclical low trend suggests that the index could bottom on September 28, 2015. Of course one must allow an error on either side of about one month, suggesting that the low could be between the end of August and end of October. |

|
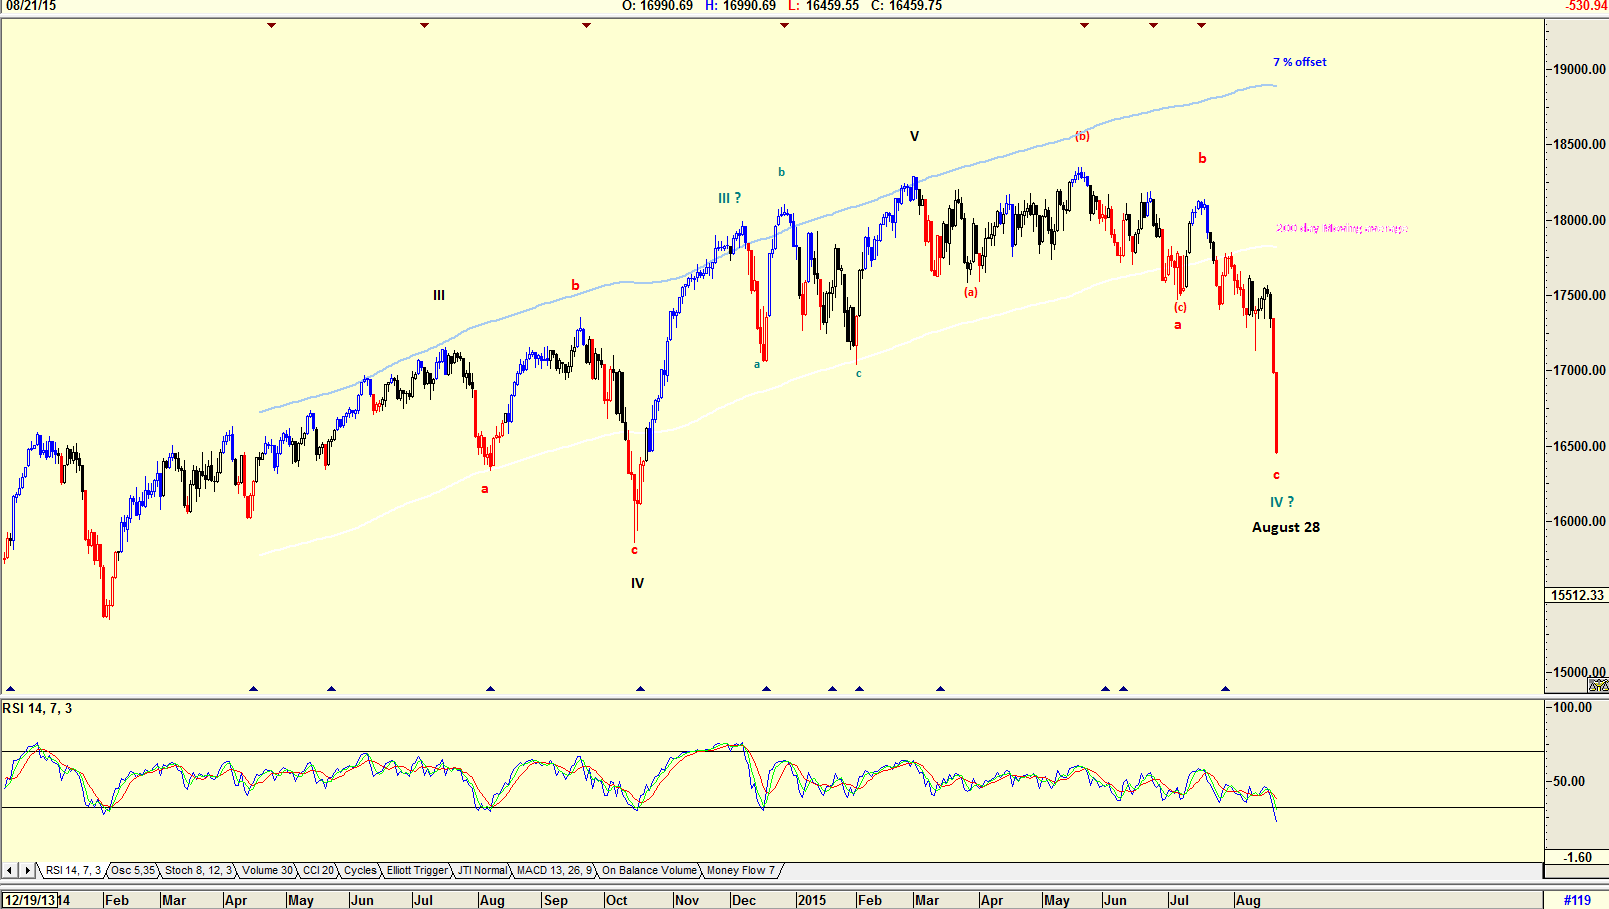
| Figure 2. Daily Chart Of The Dow Jones Industrial Average (DJIA). This chart suggests that the Wave IV low could occur on August 28, 2015. |
| Graphic provided by: AdvancedGET. |
| |
| Looking at the daily chart of the Dow Jones Industrial Average in Figure 2, you can see the complications of the Elliott wave count. The RSI is suggesting that the Wave III top should be at the high labeled III? on the chart with the Wave IV low on August 28, 2015. This does tie in with the monthly chart. Note that where you see Wave IV? labeled on the chart is far below the 200-period moving average, suggesting that a correction up should occur in the near future. The RSI is also at oversold levels. My article published in TASC suggests that a strong correction is due in 2016 based on the economic correction shown by the Kondratieff wave. In the past this has usually occurred after the K-wave forecast as unsophisticated investors enter the market at market tops. The charts suggest this pattern may have changed. However, if the alternate Elliott wave count is correct, that is, where August 28, 2015 is truly a Wave IV, then we could expect a strong rise into a Wave V topping sometime in the year 2016. Complicated, yes, but is that not the Elliott wave count of today — a simple signpost in the wilderness rather than a market forecast? |
Has been a technical analyst since 1969, and has worked as a futures and options trader with First Financial Futures in Johannesburg, South Africa.
| Address: | 3256 West 24th Ave |
| Vancouver, BC | |
| Phone # for sales: | 6042634214 |
| E-mail address: | petroosp@gmail.com |
Click here for more information about our publications!
Comments

Request Information From Our Sponsors
- StockCharts.com, Inc.
- Candle Patterns
- Candlestick Charting Explained
- Intermarket Technical Analysis
- John Murphy on Chart Analysis
- John Murphy's Chart Pattern Recognition
- John Murphy's Market Message
- MurphyExplainsMarketAnalysis-Intermarket Analysis
- MurphyExplainsMarketAnalysis-Visual Analysis
- StockCharts.com
- Technical Analysis of the Financial Markets
- The Visual Investor
- VectorVest, Inc.
- Executive Premier Workshop
- One-Day Options Course
- OptionsPro
- Retirement Income Workshop
- Sure-Fire Trading Systems (VectorVest, Inc.)
- Trading as a Business Workshop
- VectorVest 7 EOD
- VectorVest 7 RealTime/IntraDay
- VectorVest AutoTester
- VectorVest Educational Services
- VectorVest OnLine
- VectorVest Options Analyzer
- VectorVest ProGraphics v6.0
- VectorVest ProTrader 7
- VectorVest RealTime Derby Tool
- VectorVest Simulator
- VectorVest Variator
- VectorVest Watchdog
