HOT TOPICS LIST
- MACD
- Fibonacci
- RSI
- Gann
- ADXR
- Stochastics
- Volume
- Triangles
- Futures
- Cycles
- Volatility
- ZIGZAG
- MESA
- Retracement
- Aroon
INDICATORS LIST
LIST OF TOPICS
PRINT THIS ARTICLE
by Koos van der Merwe
When the stock market falls, is it wise to look for shares that are suggesting a bottom as a possible future buy?
Position: Buy
Koos van der Merwe
Has been a technical analyst since 1969, and has worked as a futures and options trader with First Financial Futures in Johannesburg, South Africa.
PRINT THIS ARTICLE
TECHNICAL ANALYSIS
A Share To Watch
08/18/15 02:47:50 PMby Koos van der Merwe
When the stock market falls, is it wise to look for shares that are suggesting a bottom as a possible future buy?
Position: Buy
| Ritchie Bros. Auctioneers, Inc. (RBA) is the world's largest auctioneer of heavy equipment and trucks. They consider themselves to be the auction experts, advertising that they have been helping people around the world buy and sell with confidence since 1958. For example, in 2014, US$4.2 billion of heavy equipment was bought and sold at unreserved public auctions that they held — auctions where they offered a wide range of unused and used equipment and trucks for sale. With the US economy possibly entering a period of stagnation as suggested by the Dow falling to its January 2015 levels and with a September interest rate hike a definite possibility further depressing the market, looking for stocks to own if and when the market starts recovering is a good play. |

|
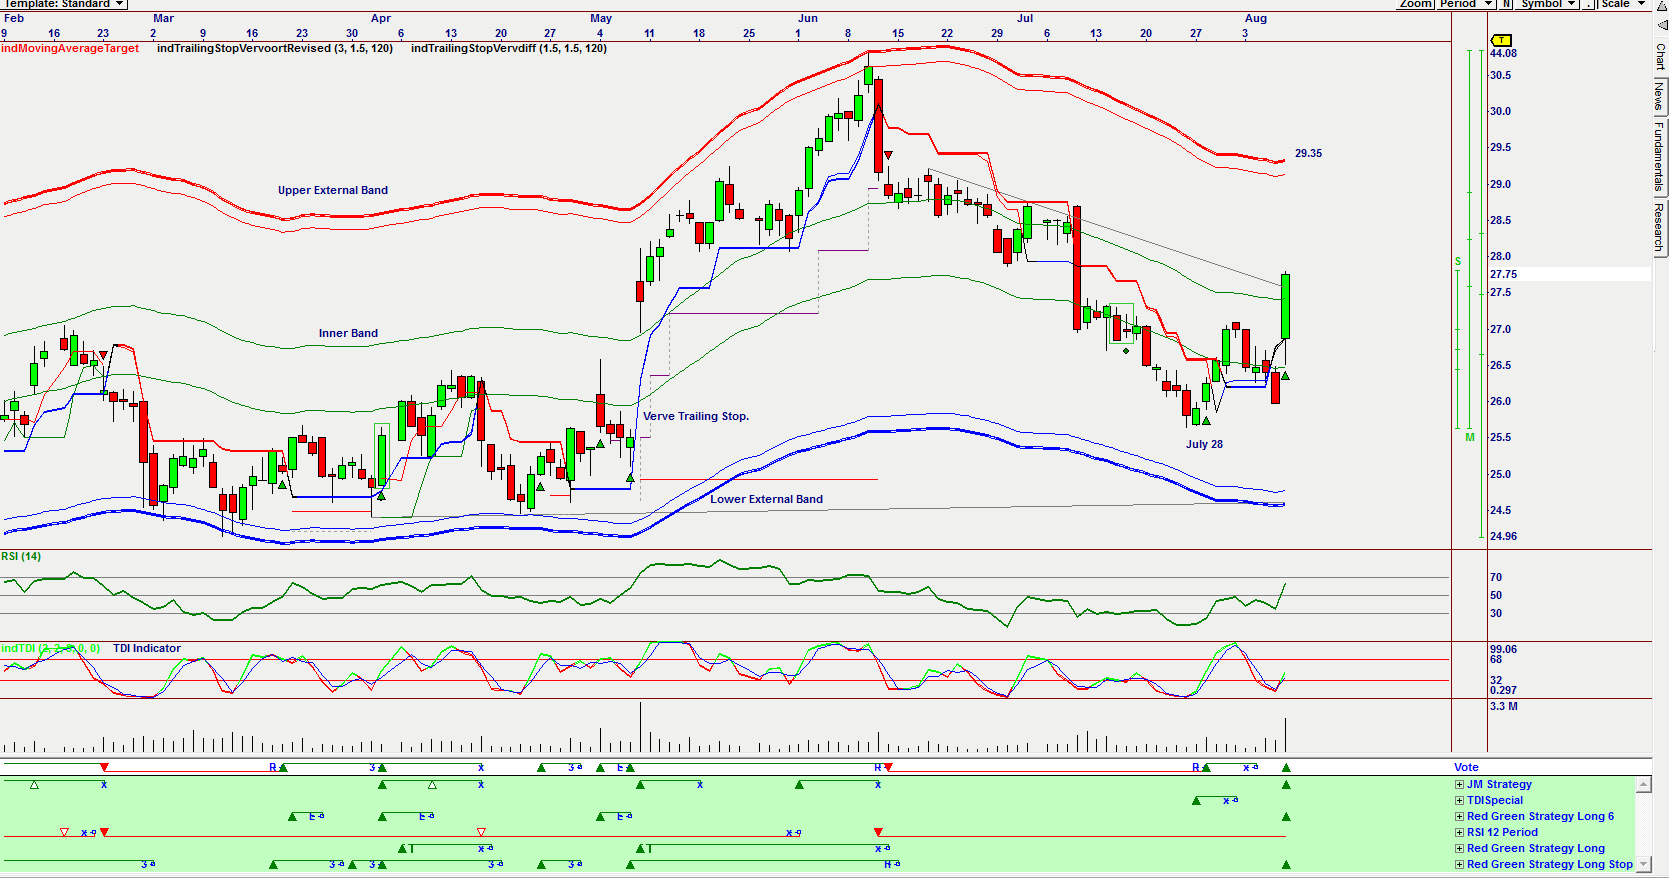
| Figure 1. Daily Chart Of Ritchie Bros. Auctioners (RBA). The TDI indicator is suggesting a buy and the RSI(14) is rising after suggeting a buy on July 28, 2015. |
| Graphic provided by: Omnitrader.. |
| |
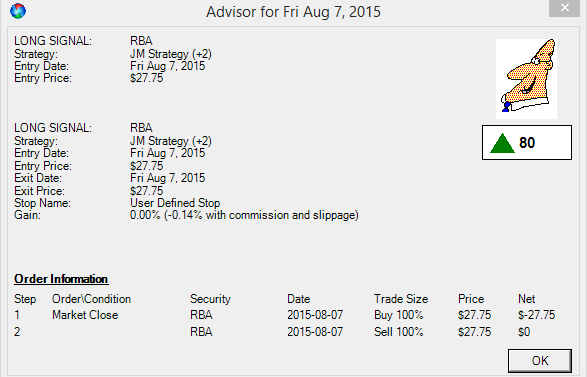
| The chart in Figure 1 is an Omnitrader chart where three strategies shown in green below the vote line have suggested buy signals, as consolidated in the vote line. Note the two indicators on the chart, the RSI(14) and the TDI indicator. The TDI indicator is suggesting a buy and the RSI is rising after suggesting a buy on July 28, 2015. The share price fell below the lower inner band but has presently risen above it, suggesting a possible rise to the upper external band at $29.35 or higher. The advisor rating for August 7, 2015 is 80, which is a high figure and is based on the JM strategy. |

|
| Figure 2. The Advisor Rating. This rating is also suggesting a buy. |
| Graphic provided by: Omnitrader. |
| |
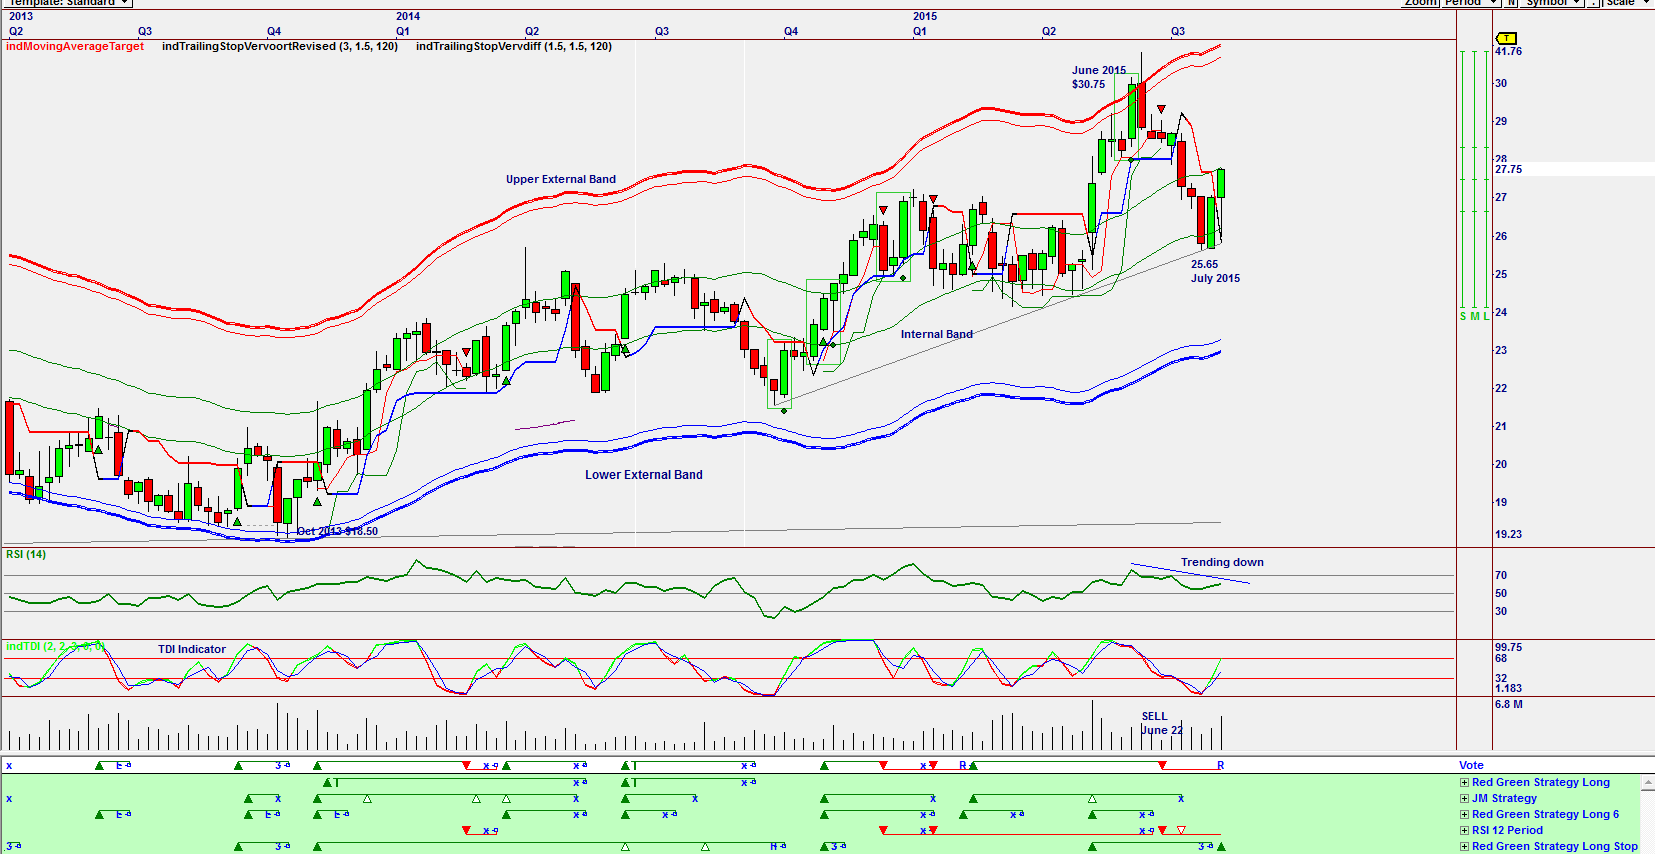
| When you look at the weekly Omnitrader chart in Figure 3, you can see how the share price bounced off the lower external band in October 2013 when the stock price was $18.50, rose to the upper external band by June 2015 at $30.75, and has now fallen to the lower internal band at $25.65 in July 2015. The RSI is trending down, suggesting possible weakness, but the TDI indicator has given a buy signal. Also note that the short sell signal given on the vote line on June 22, 2015 has been stopped out. Also note the "red green strategy long stop" in the green area below the vote line has given a buy. |

|
| Figure 3. Weekly Chart Suggesting A Buy. The indicators on the weekly chart are also suggesting a buy. |
| Graphic provided by: Omnitrader. |
| |
| Looking at RBA as a possible buy in the falling market could be nerve racking, but placing trust in your technical analysis strategy is a gamble worth taking. I would be a buyer of RBA for a short-term hold with close stops. |
Has been a technical analyst since 1969, and has worked as a futures and options trader with First Financial Futures in Johannesburg, South Africa.
| Address: | 3256 West 24th Ave |
| Vancouver, BC | |
| Phone # for sales: | 6042634214 |
| E-mail address: | petroosp@gmail.com |
Click here for more information about our publications!
PRINT THIS ARTICLE

|

Request Information From Our Sponsors
- VectorVest, Inc.
- Executive Premier Workshop
- One-Day Options Course
- OptionsPro
- Retirement Income Workshop
- Sure-Fire Trading Systems (VectorVest, Inc.)
- Trading as a Business Workshop
- VectorVest 7 EOD
- VectorVest 7 RealTime/IntraDay
- VectorVest AutoTester
- VectorVest Educational Services
- VectorVest OnLine
- VectorVest Options Analyzer
- VectorVest ProGraphics v6.0
- VectorVest ProTrader 7
- VectorVest RealTime Derby Tool
- VectorVest Simulator
- VectorVest Variator
- VectorVest Watchdog
- StockCharts.com, Inc.
- Candle Patterns
- Candlestick Charting Explained
- Intermarket Technical Analysis
- John Murphy on Chart Analysis
- John Murphy's Chart Pattern Recognition
- John Murphy's Market Message
- MurphyExplainsMarketAnalysis-Intermarket Analysis
- MurphyExplainsMarketAnalysis-Visual Analysis
- StockCharts.com
- Technical Analysis of the Financial Markets
- The Visual Investor
