HOT TOPICS LIST
- MACD
- Fibonacci
- RSI
- Gann
- ADXR
- Stochastics
- Volume
- Triangles
- Futures
- Cycles
- Volatility
- ZIGZAG
- MESA
- Retracement
- Aroon
INDICATORS LIST
LIST OF TOPICS
PRINT THIS ARTICLE
by Koos van der Merwe
When a head & shoulders pattern has hit the target suggested by the pattern, do you buy the share or do you wait for a more definite buy signal?
Position: Accumulate
Koos van der Merwe
Has been a technical analyst since 1969, and has worked as a futures and options trader with First Financial Futures in Johannesburg, South Africa.
PRINT THIS ARTICLE
HEAD & SHOULDERS
Do You Buy When A Head & Shouders Has Bottomed?
08/13/15 02:49:29 PMby Koos van der Merwe
When a head & shoulders pattern has hit the target suggested by the pattern, do you buy the share or do you wait for a more definite buy signal?
Position: Accumulate
| The head & shoulders pattern is one of the more popular patterns used by technical analysts. In fact, even some fundamental analysts use them from time to time. So, when the price of a stock reaches the target suggested by the pattern, do you simply go in and buy or do you wait for a buy signal to be given on one of the preferred indicators you follow? |

|
| Figure 1. Chart showing the Head and Shoulder pattern. |
| Graphic provided by: AdvancedGET. |
| |
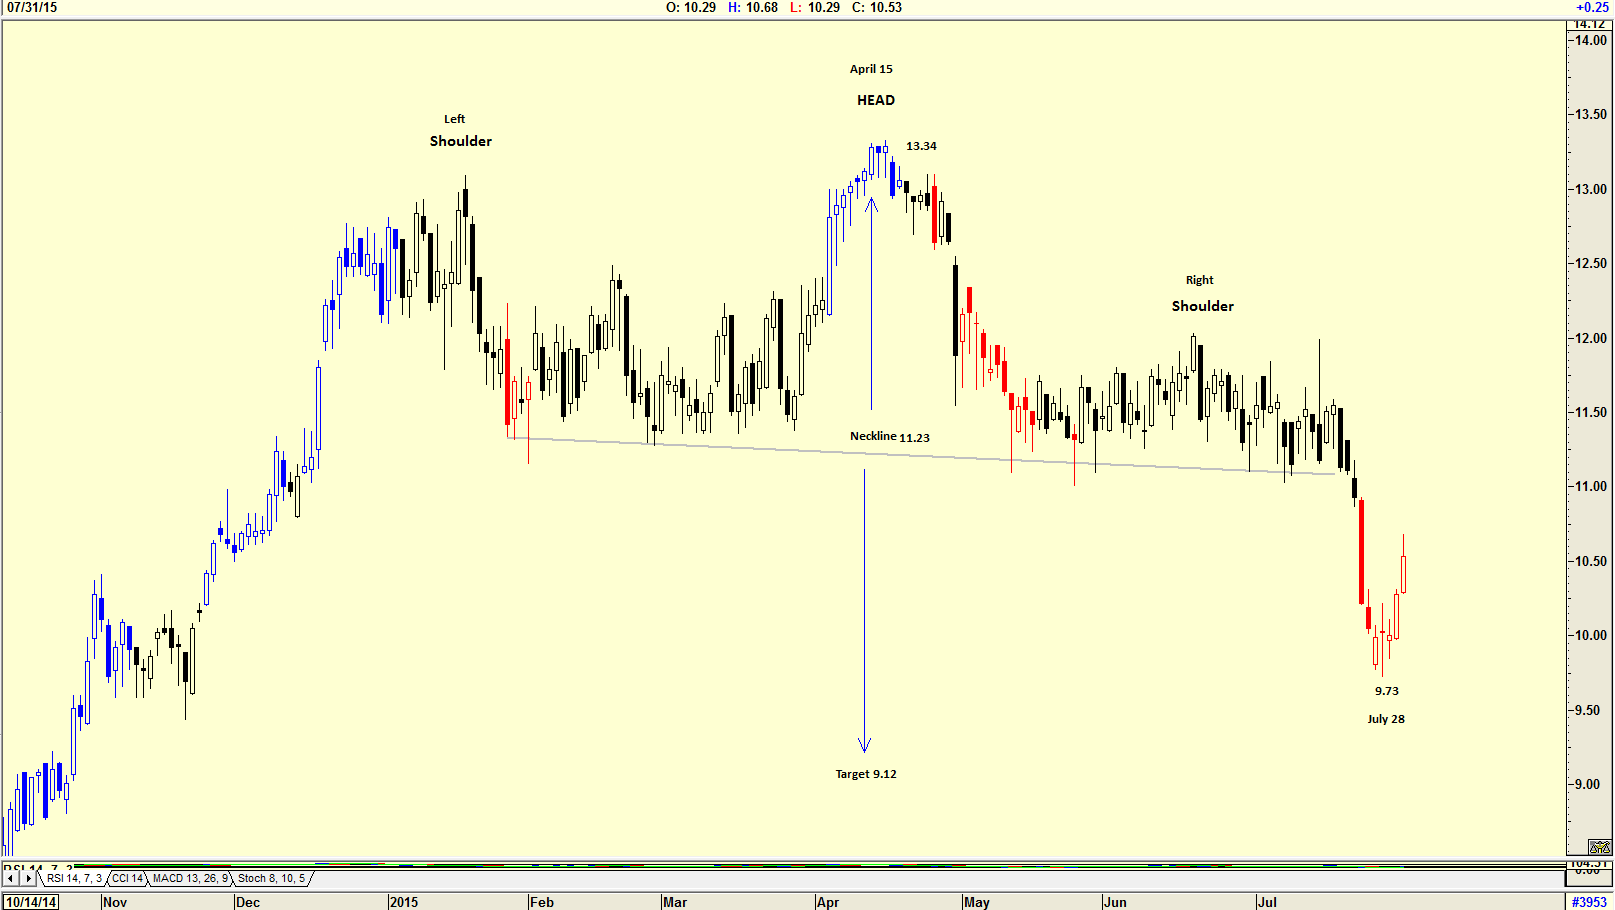
| The chart in Figure 1 is a daily chart of Entercom Communications (ETM), showing the head & shoulders pattern that has formed with the head appearing on April 15, 2015 at $13.34. The target suggested is $9.12. This is calculated by subtracting the neckline (11.23) which is the support level from the left shoulder to the right shoulder, from the head, and then projecting the result below the neckline or (13.34 - 11.23 = 2.11. 11.23 - 2.11 = 9.12). With the low of $9.73 reached by the stock price on July 28, 2015 do you buy the share or do you wait for one of your favorite indicators to suggest a buy? |

|
| Figure 2. Chart showing a few indicators |
| Graphic provided by: AdvancedGET. |
| |
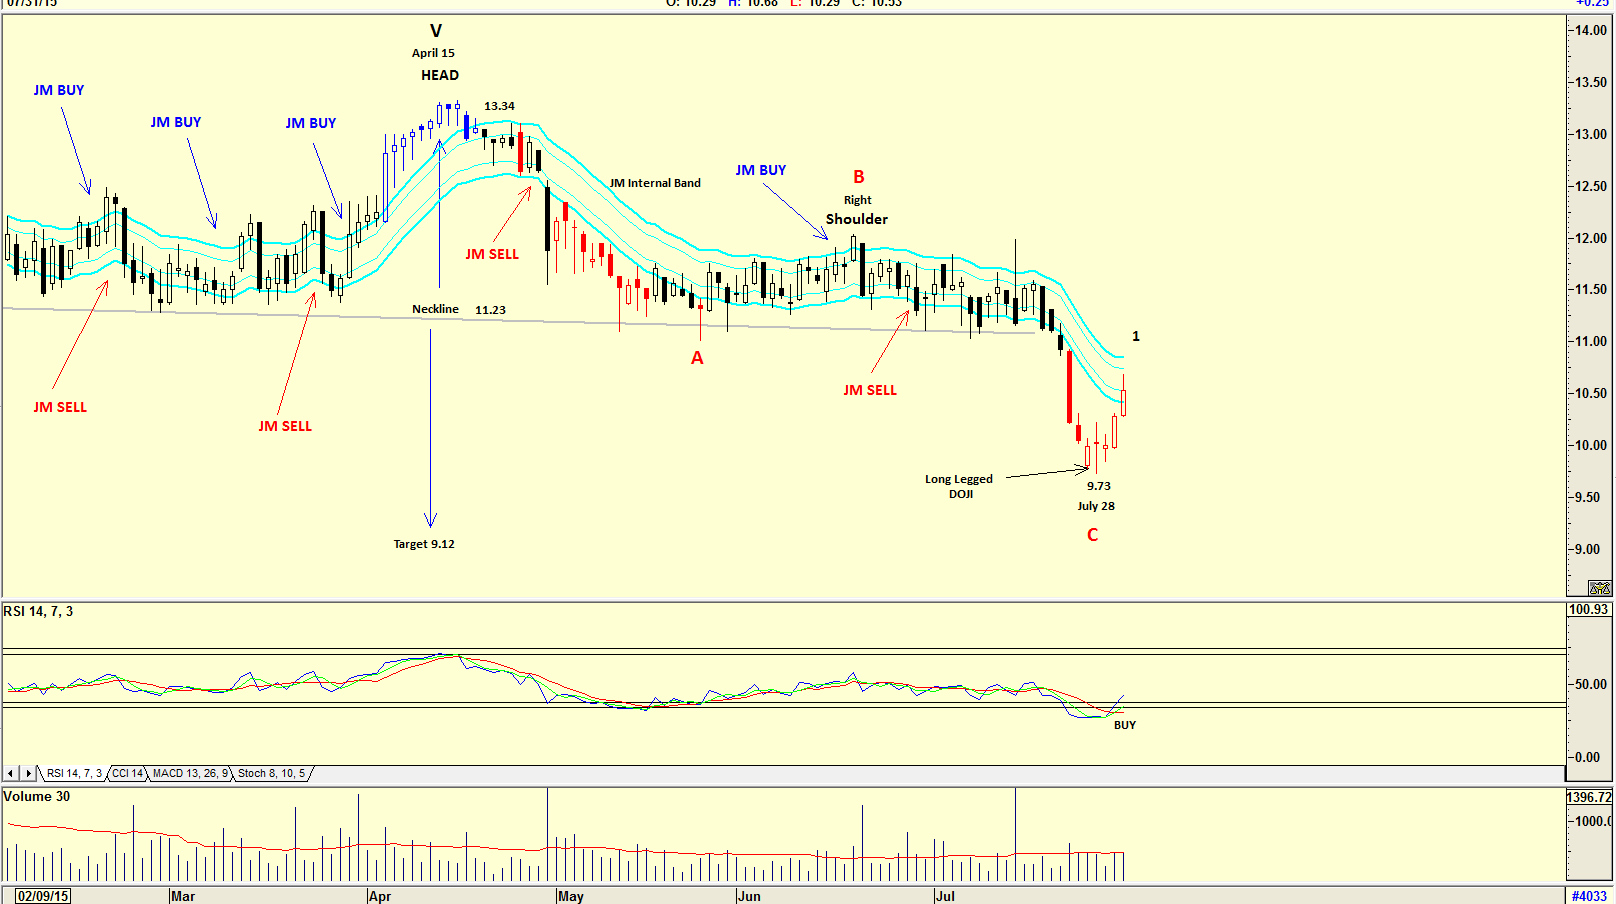
| The chart in Figure 2 is a daily chart showing a JM internal band and the relative strength index (RSI). The JM internal band is a 15-period simple moving average offset by 2% positive and 2% negative. A move above the upper band suggests a buy, while a move below the lower band suggests a sell. At the moment, the stock price is still in sell mode, and has not given a buy. The RSI on the other hand, has given a buy. A long legged doji candlestick formed on July 28, 2015. This type of doji is used as a signal to indicate indecision in the market. In this case the indecision was whether the share price would continue to fall or if it would start rising. Of course the latter occurred as can be seen on the chart. Finally, note the Elliott Wave count which has suggested that a Wave C has been completed, and that the price could now be rising in a Wave 1. A target for wave 1 could be the upper JM internal band, but this is not definite. A wave 1 is followed by a wave 2 which can be as much as a 100% retracement depending on the overall market performance. Finally note the volume which is below average but has strengthened as the price rose, a positive sign. Day traders could start nibbling at ETM stock based on the RSI buy signal. However, long-term investors could wait for a buy signal to be given by the JM internal band indicator or wait for the completion of the wave 2. |
Has been a technical analyst since 1969, and has worked as a futures and options trader with First Financial Futures in Johannesburg, South Africa.
| Address: | 3256 West 24th Ave |
| Vancouver, BC | |
| Phone # for sales: | 6042634214 |
| E-mail address: | petroosp@gmail.com |
Click here for more information about our publications!
PRINT THIS ARTICLE

Request Information From Our Sponsors
- StockCharts.com, Inc.
- Candle Patterns
- Candlestick Charting Explained
- Intermarket Technical Analysis
- John Murphy on Chart Analysis
- John Murphy's Chart Pattern Recognition
- John Murphy's Market Message
- MurphyExplainsMarketAnalysis-Intermarket Analysis
- MurphyExplainsMarketAnalysis-Visual Analysis
- StockCharts.com
- Technical Analysis of the Financial Markets
- The Visual Investor
- VectorVest, Inc.
- Executive Premier Workshop
- One-Day Options Course
- OptionsPro
- Retirement Income Workshop
- Sure-Fire Trading Systems (VectorVest, Inc.)
- Trading as a Business Workshop
- VectorVest 7 EOD
- VectorVest 7 RealTime/IntraDay
- VectorVest AutoTester
- VectorVest Educational Services
- VectorVest OnLine
- VectorVest Options Analyzer
- VectorVest ProGraphics v6.0
- VectorVest ProTrader 7
- VectorVest RealTime Derby Tool
- VectorVest Simulator
- VectorVest Variator
- VectorVest Watchdog
