HOT TOPICS LIST
- MACD
- Fibonacci
- RSI
- Gann
- ADXR
- Stochastics
- Volume
- Triangles
- Futures
- Cycles
- Volatility
- ZIGZAG
- MESA
- Retracement
- Aroon
INDICATORS LIST
LIST OF TOPICS
PRINT THIS ARTICLE
by David Penn
This bearish reversal pattern is just another sign that the October rally is over.
Position: N/A
David Penn
Technical Writer for Technical Analysis of STOCKS & COMMODITIES magazine, Working-Money.com, and Traders.com Advantage.
PRINT THIS ARTICLE
HEAD & SHOULDERS
The Dow Industrial's Head and Shoulders Top
11/15/02 12:16:27 PMby David Penn
This bearish reversal pattern is just another sign that the October rally is over.
Position: N/A
| If you are unimpressed by this argument that the shares of large, blue-chip companies have peaked in the near-term, then rest assured you've got good company. As I've shown colleagues what appears to me to be an emerging head and shoulders top in the Dow Industrials, I've been met with the sort of skepticism that, quite frankly, only helps me to work harder to make the case. |
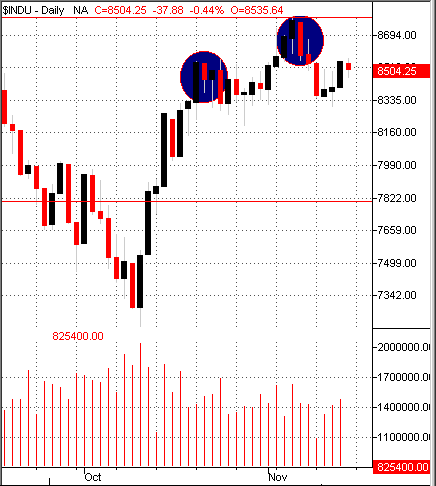
| The case for a head and shoulders top in the Dow Industrials is two-fold. The foundation of the case begins in the declining volume that has accompanied the October rally ever since its beginning with the October 10th bottom at 7192. This rally exploded over the next several days, almost without interruption until reaching a peak on October 21st at about 8545--a 1,353 point move. After pulling back for a few days, the rally resumed, eventually peaking at 8791 on November 6th. |

|
| Figure 1: The failure of prices to move higher after the peak on November 6th suggested a 2B test of top failure. |
| Graphic provided by: TradeStation. |
| |
| Sellers stepped in swiftly at this point, taking the Dow Industrials down 485 points to 8306 in three strongly bearish days. This was the earliest sign that the October rally was, if not over, then at least due for a period of consolidation. The rule here is reminiscent of Vic Sperandeo's 2B test (see his "Methods of a Wall Street Master" or "Principles of Professional Speculation", or my Traders.com Advantage article, "December Corn's 2B Test of Top" from September 13th). The 2B test, at root, suggests that when prices advance to a new high, pull back, and then advance again to take out the previous high (the "old new high"), it becomes imperative for prices to follow-through if the bullish trend is to be confirmed. If prices do not continue upward, if, instead, prices retreat from the "new new high", then it is likely that the advance has run out of steam and that a decline is, in fact, more likely. While the Dow Industrials have yet to breakdown in such a decline, it is noteworthy that just such a 2B test setup exists. |
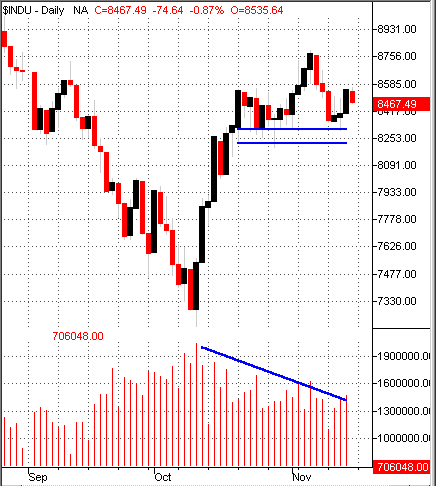
| Instead of an immediate breakdown, the Dow Industrials have recently attempted to move back up after rallying from support at the 8300 level. So far, this three-day attempt looks particularly anemic--both in terms of price gains as well as with regard to volume, which continues to decline. If the current rally in the Dow Industrials meets resistance in the 8550 area (which, incidentally, represents the October high), and retreats to support at 8300, then the 20+ head and shoulders top will likely be realized. This head and shoulders top would then consist of the October high reached on the 21st (the left shoulder peak), the high reached on November 6th (the head peak), and the mid-November rally peak on the 14th (the right shoulder peak). |
 Figure 2: Should this head and shoulders top be completed, then a decline to the 8300 level might be next. What are the implications of a fully-realized head and shoulders top here? Given support at 8300 (the "neckline" as it is called) and the "head peak" at 8791, the head and shoulders top would appear to have a formation size of about 491 points. Thus, a successful breakdown would take the Dow Industrials down to the 7800 area. There is not a tremendous amount of explicit support here, save for the diamond-shaped congestion from late September that augured the last leg of the Dow Industrials move down from the August 22nd peak to the October 10th bottom. But such a move down to this area could set up a test of the October lows, a test that would be necessary if the Dow Industrials are to truly return to bullish form over the longer term. |
Technical Writer for Technical Analysis of STOCKS & COMMODITIES magazine, Working-Money.com, and Traders.com Advantage.
| Title: | Technical Writer |
| Company: | Technical Analysis, Inc. |
| Address: | 4757 California Avenue SW |
| Seattle, WA 98116 | |
| Phone # for sales: | 206 938 0570 |
| Fax: | 206 938 1307 |
| Website: | www.Traders.com |
| E-mail address: | DPenn@traders.com |
Traders' Resource Links | |
| Charting the Stock Market: The Wyckoff Method -- Books | |
| Working-Money.com -- Online Trading Services | |
| Traders.com Advantage -- Online Trading Services | |
| Technical Analysis of Stocks & Commodities -- Publications and Newsletters | |
| Working Money, at Working-Money.com -- Publications and Newsletters | |
| Traders.com Advantage -- Publications and Newsletters | |
| Professional Traders Starter Kit -- Software | |
Click here for more information about our publications!
Comments
Date: 11/19/02Rank: 5Comment:
Date: 11/19/02Rank: 4Comment:

|

Request Information From Our Sponsors
- StockCharts.com, Inc.
- Candle Patterns
- Candlestick Charting Explained
- Intermarket Technical Analysis
- John Murphy on Chart Analysis
- John Murphy's Chart Pattern Recognition
- John Murphy's Market Message
- MurphyExplainsMarketAnalysis-Intermarket Analysis
- MurphyExplainsMarketAnalysis-Visual Analysis
- StockCharts.com
- Technical Analysis of the Financial Markets
- The Visual Investor
- VectorVest, Inc.
- Executive Premier Workshop
- One-Day Options Course
- OptionsPro
- Retirement Income Workshop
- Sure-Fire Trading Systems (VectorVest, Inc.)
- Trading as a Business Workshop
- VectorVest 7 EOD
- VectorVest 7 RealTime/IntraDay
- VectorVest AutoTester
- VectorVest Educational Services
- VectorVest OnLine
- VectorVest Options Analyzer
- VectorVest ProGraphics v6.0
- VectorVest ProTrader 7
- VectorVest RealTime Derby Tool
- VectorVest Simulator
- VectorVest Variator
- VectorVest Watchdog
