

HOT TOPICS LIST
- MACD
- Fibonacci
- RSI
- Gann
- ADXR
- Stochastics
- Volume
- Triangles
- Futures
- Cycles
- Volatility
- ZIGZAG
- MESA
- Retracement
- Aroon
INDICATORS LIST
LIST OF TOPICS
PRINT THIS ARTICLE
by Chaitali Mohile
Cempra is ready to initiate a fresh breakout rally.
Position: Buy
Chaitali Mohile
Active trader in the Indian stock markets since 2003 and a full-time writer. Trading is largely based upon technical analysis.
PRINT THIS ARTICLE
FLAGS AND PENNANTS
The Bullish Breakout Of Cempra
07/29/15 02:24:42 PMby Chaitali Mohile
Cempra is ready to initiate a fresh breakout rally.
Position: Buy
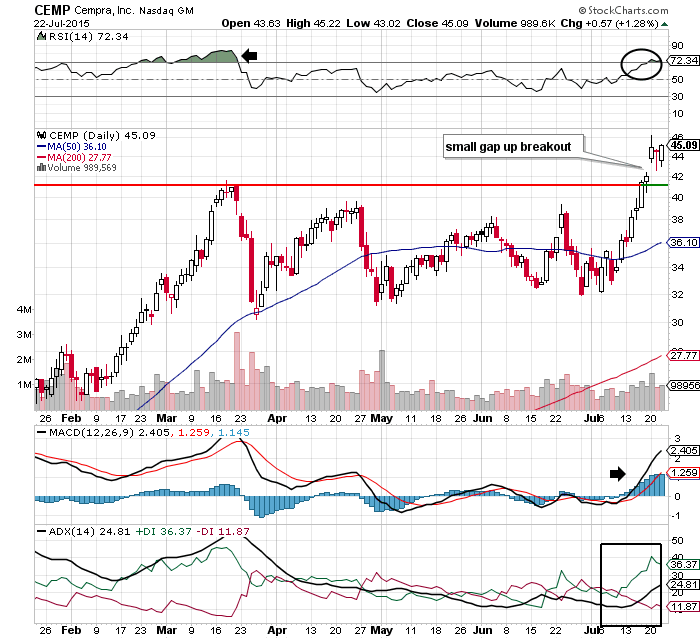
| Cempra Inc (CEMP) is a strong stock in the health care sector, which is currently in an uptrend. CEMP has been consolidating for about three to four months. The stock traded in a wide range between $30 and $40 along the support-resistance of the 50-day moving average (MA). The trading range was well respected during the sideways price action. The relative strength index (RSI)(14), and the moving average convergence/divergence (MACD) (12,26,9) showed shaky movements near their center line, suggesting directionless action. The buying pressure (green line) and selling pressure (red line) of the average directional index (ADX) (14) were tangled, indicating consolidation for CEMP. |
|
| Figure 1. Daily Chart Of Cempra Inc. (CEMP). The stock breached the upper resistance line at $40 with a small gap up. |
| Graphic provided by: StockCharts.com. |
| |
| However, the stock has recently breached the upper resistance line at $40 with a small gap up on the daily chart in Figure 1. This bullish breakout would increase the buying pressure on the stock as the indicators are suggesting fresh buying opportunities. Although the stock could drop to fill the gap up, traders need not worry about CEMP as it has strong support of its previous high at around $40. In addition, the stock has a history of a strong uptrend. The ADX (14) in Figure 1 is showing a new developing uptrend. The MACD (12,26,9) has turned positive by undergoing a bullish crossover at the zero line. But the RSI (14) requires attention near 80 levels. Earlier the indicator had dropped from an overbought region, initiating the consolidation period for the stock. |
| However, you cannot follow an indicator in isolation. Therefore, momentum strength and the developing uptrend are likely to take care of the RSI (14). Hence traders and investors can enter the long trade for CEMP. |
|
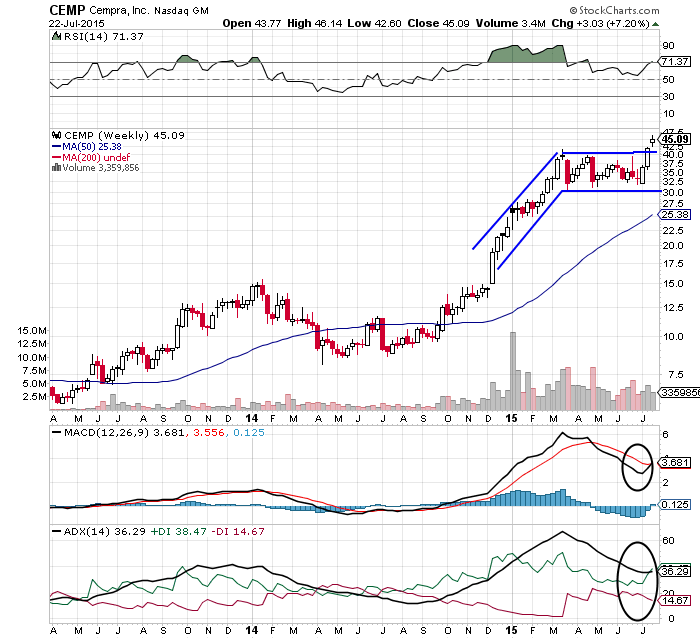
| Figure 2. Weekly Chart Of CEMP. Here you see a bullish flag & pennant pattern. |
| Graphic provided by: StockCharts.com. |
| |
| A bullish flag & pennant continuation pattern appears on the weekly chart in Figure 2. This pattern breaks in an upward direction and resumes the previous advance rally. During the bullish rally from $15 to $40, all the three indicators turned extremely bullish. As a result, the stock entered sideways consolidation. Meanwhile, the RSI (14), the MACD (12,26,9) and the ADX (14) descended from their overbought positions, creating room for a future rally. Recently, CEMP has witnessed robust bullish breakout of the flag & pennant pattern. This would be a good low risk buying opportunity for traders. |
| The RSI (14) is ready to surge above the 70 levels, highlighting a fresh trading signal. The bullish crossover of the MACD (12,26,9) is strong momentum in the rally. In addition, CEMP has a history of a strong uptrend. Therefore, traders can enter a long trade at the breakout point with a stop-loss near $37. The minimum estimated target is measured by adding the length of the flag pole (size of advance rally) to the breakout point, that is, (40-15 = 25 + 40 = 65). Thus, $65 would be the price target for CEMP. To conclude, CEMP is a strong stock that has attractive buying opportunities and is a relatively low risk buy. |
Active trader in the Indian stock markets since 2003 and a full-time writer. Trading is largely based upon technical analysis.
| Company: | Independent |
| Address: | C1/3 Parth Indraprasth Towers. Vastrapur |
| Ahmedabad, Guj 380015 | |
| E-mail address: | chaitalimohile@yahoo.co.in |
Traders' Resource Links | |
| Independent has not added any product or service information to TRADERS' RESOURCE. | |
Click here for more information about our publications!
Comments

Request Information From Our Sponsors
- StockCharts.com, Inc.
- Candle Patterns
- Candlestick Charting Explained
- Intermarket Technical Analysis
- John Murphy on Chart Analysis
- John Murphy's Chart Pattern Recognition
- John Murphy's Market Message
- MurphyExplainsMarketAnalysis-Intermarket Analysis
- MurphyExplainsMarketAnalysis-Visual Analysis
- StockCharts.com
- Technical Analysis of the Financial Markets
- The Visual Investor
- VectorVest, Inc.
- Executive Premier Workshop
- One-Day Options Course
- OptionsPro
- Retirement Income Workshop
- Sure-Fire Trading Systems (VectorVest, Inc.)
- Trading as a Business Workshop
- VectorVest 7 EOD
- VectorVest 7 RealTime/IntraDay
- VectorVest AutoTester
- VectorVest Educational Services
- VectorVest OnLine
- VectorVest Options Analyzer
- VectorVest ProGraphics v6.0
- VectorVest ProTrader 7
- VectorVest RealTime Derby Tool
- VectorVest Simulator
- VectorVest Variator
- VectorVest Watchdog