HOT TOPICS LIST
- MACD
- Fibonacci
- RSI
- Gann
- ADXR
- Stochastics
- Volume
- Triangles
- Futures
- Cycles
- Volatility
- ZIGZAG
- MESA
- Retracement
- Aroon
INDICATORS LIST
LIST OF TOPICS
PRINT THIS ARTICLE
by Koos van der Merwe
Apple, Apple, and once again Apple. The company appears to be going from strength to strength. Is it time to buy the company's stock again?
Position: Buy
Koos van der Merwe
Has been a technical analyst since 1969, and has worked as a futures and options trader with First Financial Futures in Johannesburg, South Africa.
PRINT THIS ARTICLE
TECHNICAL ANALYSIS
Is Apple, Inc. A Buy Again?
07/24/15 02:36:42 PMby Koos van der Merwe
Apple, Apple, and once again Apple. The company appears to be going from strength to strength. Is it time to buy the company's stock again?
Position: Buy
| "Apple will pay consumers $400 million under the terms of an e-books settlement." This District Court decision was upheld by the Second Circuit, on June 30, 2015. On July 15, 2015 Apple, Inc. (AAPL) introduced the best iPod touch yet. The i-Watch, which was recently released, has been a good seller, possibly not as great as anticipated, with sales of watch straps bringing in greater profits than the i-Watch itself, or so the rumor goes. Is it a risk to buy AAPL? |

|
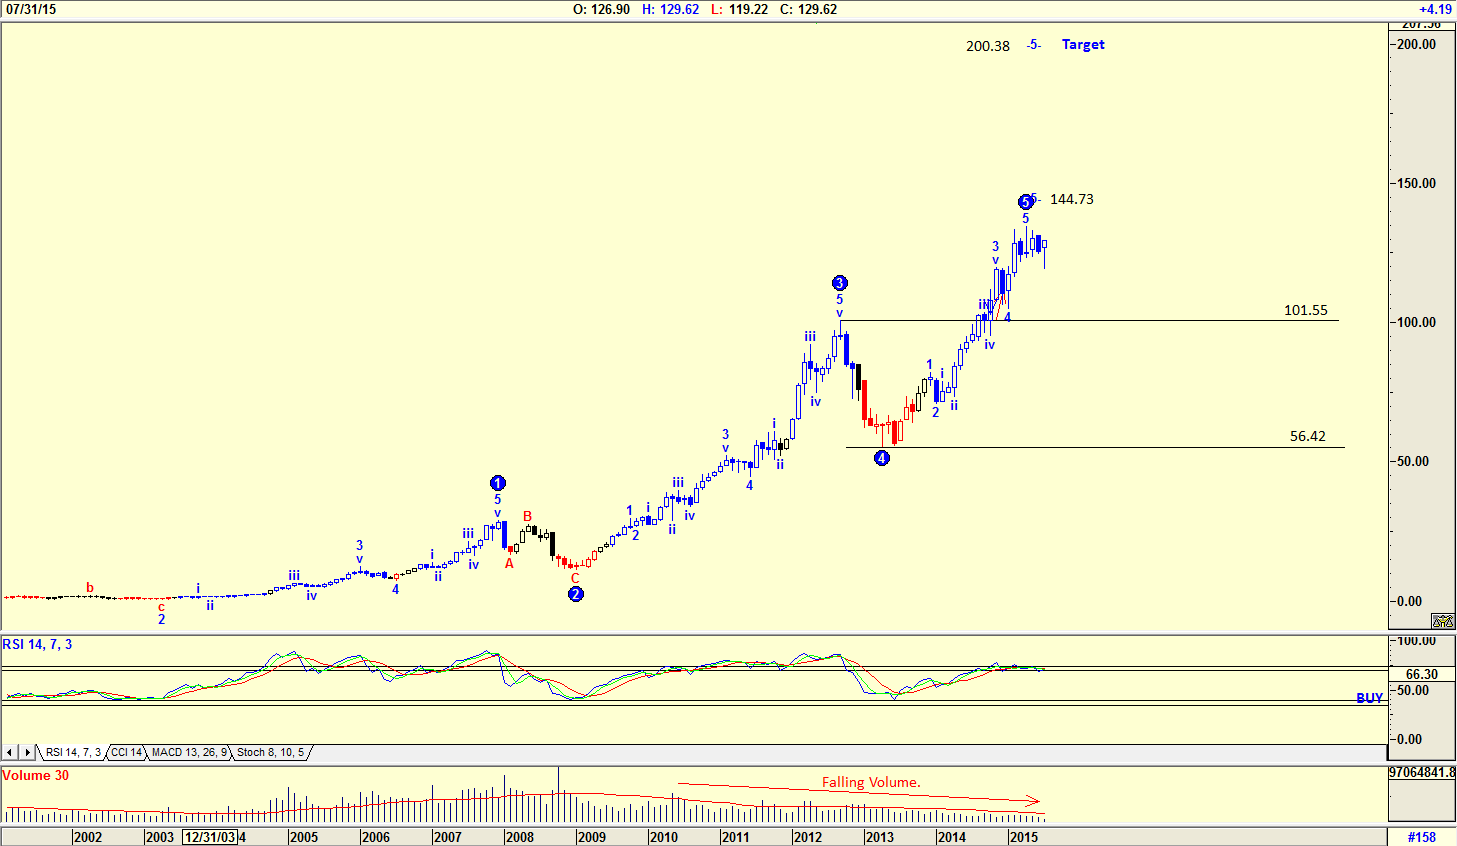
| Figure 1. Monthly Chart Of Apple, Inc. (AAPL). The Elliott wave count suggests that the stock price could be topping out in a Wave 5 at $144.73. |
| Graphic provided by: AdvancedGET. |
| |
| The chart in Figure 1 is a monthly chart of AAPL with an Elliott wave count suggesting that the share price could be topping out in a WAVE 5 at $144.73. Should this be the high of Wave 5, and the relative strength index (RSI) is at overbought levels, the share price could start falling to the fourth wave of lesser degree, somewhere between $56.42 and $101.55. However, looking at previous places where the RSI was at oversold levels, they remained there for a number of months before giving a definite sell, and the share price continued to rise strongly. This suggests that the share price could rise to $144.73 or even the Wave 5 target of $200.38. What is a concern is the falling volume as the share price rose — a sign of weakness. |

|
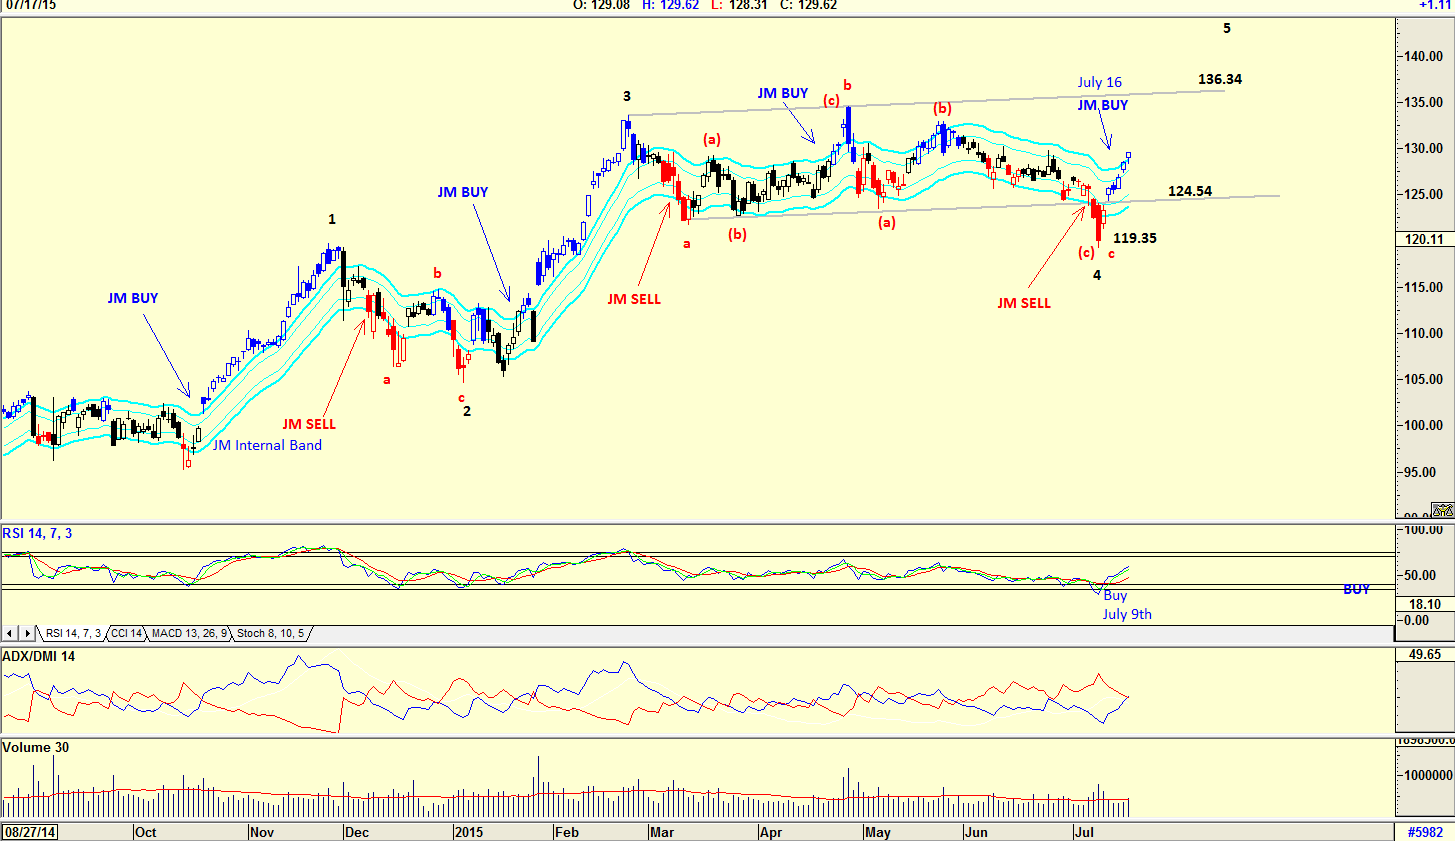
| Figure 2. Daily Chart Of AAPL. A buy signal was given by the JM internal band, ADX/DMI(14), and the RSI. |
| Graphic provided by: AdvancedGET. |
| |
| The daily chart in Figure 2 shows the JM internal band buy signal given on July 16, 2015. The JM internal band is a 15-period simple moving average offset by 2% positive and 2% negative. A buy signal is given when the price breaks above the upper band and a sell signal is given when it breaks below the lower band. Note that on July 15, 2015 the stock price suggested a buy. This is confirmed by the ADX/DMI14 indicator where the blue line crossed the red line ever so slightly. The RSI on the other hand gave a buy signal on July 9, 2015. The interim Elliott wave, shown on the chart suggests that at $119.35, the price AAPL fell to on July 9, the day the RSI suggested a buy signal, a Wave 4 was completed, and that the share price is now in a Wave 5. There is resistance at $136.34, the upper resistance line. This should be watched closely because a break above this resistance will see the share price move up strongly. I would be a buyer of AAPL at the present level, but I would keep an eye on the resistance at $136.34. After Apple, Inc.'s earnings announcement on July 21, 2015 the share price dropped even though the prospects for the future growth of the company are still strong. The stock's support level is at $124.54. It's a matter of how the stock price tests this support level. |
Has been a technical analyst since 1969, and has worked as a futures and options trader with First Financial Futures in Johannesburg, South Africa.
| Address: | 3256 West 24th Ave |
| Vancouver, BC | |
| Phone # for sales: | 6042634214 |
| E-mail address: | petroosp@gmail.com |
Click here for more information about our publications!
PRINT THIS ARTICLE

Request Information From Our Sponsors
- StockCharts.com, Inc.
- Candle Patterns
- Candlestick Charting Explained
- Intermarket Technical Analysis
- John Murphy on Chart Analysis
- John Murphy's Chart Pattern Recognition
- John Murphy's Market Message
- MurphyExplainsMarketAnalysis-Intermarket Analysis
- MurphyExplainsMarketAnalysis-Visual Analysis
- StockCharts.com
- Technical Analysis of the Financial Markets
- The Visual Investor
- VectorVest, Inc.
- Executive Premier Workshop
- One-Day Options Course
- OptionsPro
- Retirement Income Workshop
- Sure-Fire Trading Systems (VectorVest, Inc.)
- Trading as a Business Workshop
- VectorVest 7 EOD
- VectorVest 7 RealTime/IntraDay
- VectorVest AutoTester
- VectorVest Educational Services
- VectorVest OnLine
- VectorVest Options Analyzer
- VectorVest ProGraphics v6.0
- VectorVest ProTrader 7
- VectorVest RealTime Derby Tool
- VectorVest Simulator
- VectorVest Variator
- VectorVest Watchdog
