

HOT TOPICS LIST
- MACD
- Fibonacci
- RSI
- Gann
- ADXR
- Stochastics
- Volume
- Triangles
- Futures
- Cycles
- Volatility
- ZIGZAG
- MESA
- Retracement
- Aroon
INDICATORS LIST
LIST OF TOPICS
PRINT THIS ARTICLE
by Donald W. Pendergast, Jr.
Netflix, Inc. shares are surging in the wake of a one for seven stock split — but for how much longer?
Position: N/A
Donald W. Pendergast, Jr.
Freelance financial markets writer and online publisher of the Trendzetterz.com S&P 500 Weekly Forecast service.
PRINT THIS ARTICLE
CYCLES
Netflix: Powerful Rally Stretching Limits?
07/22/15 04:16:51 PMby Donald W. Pendergast, Jr.
Netflix, Inc. shares are surging in the wake of a one for seven stock split — but for how much longer?
Position: N/A
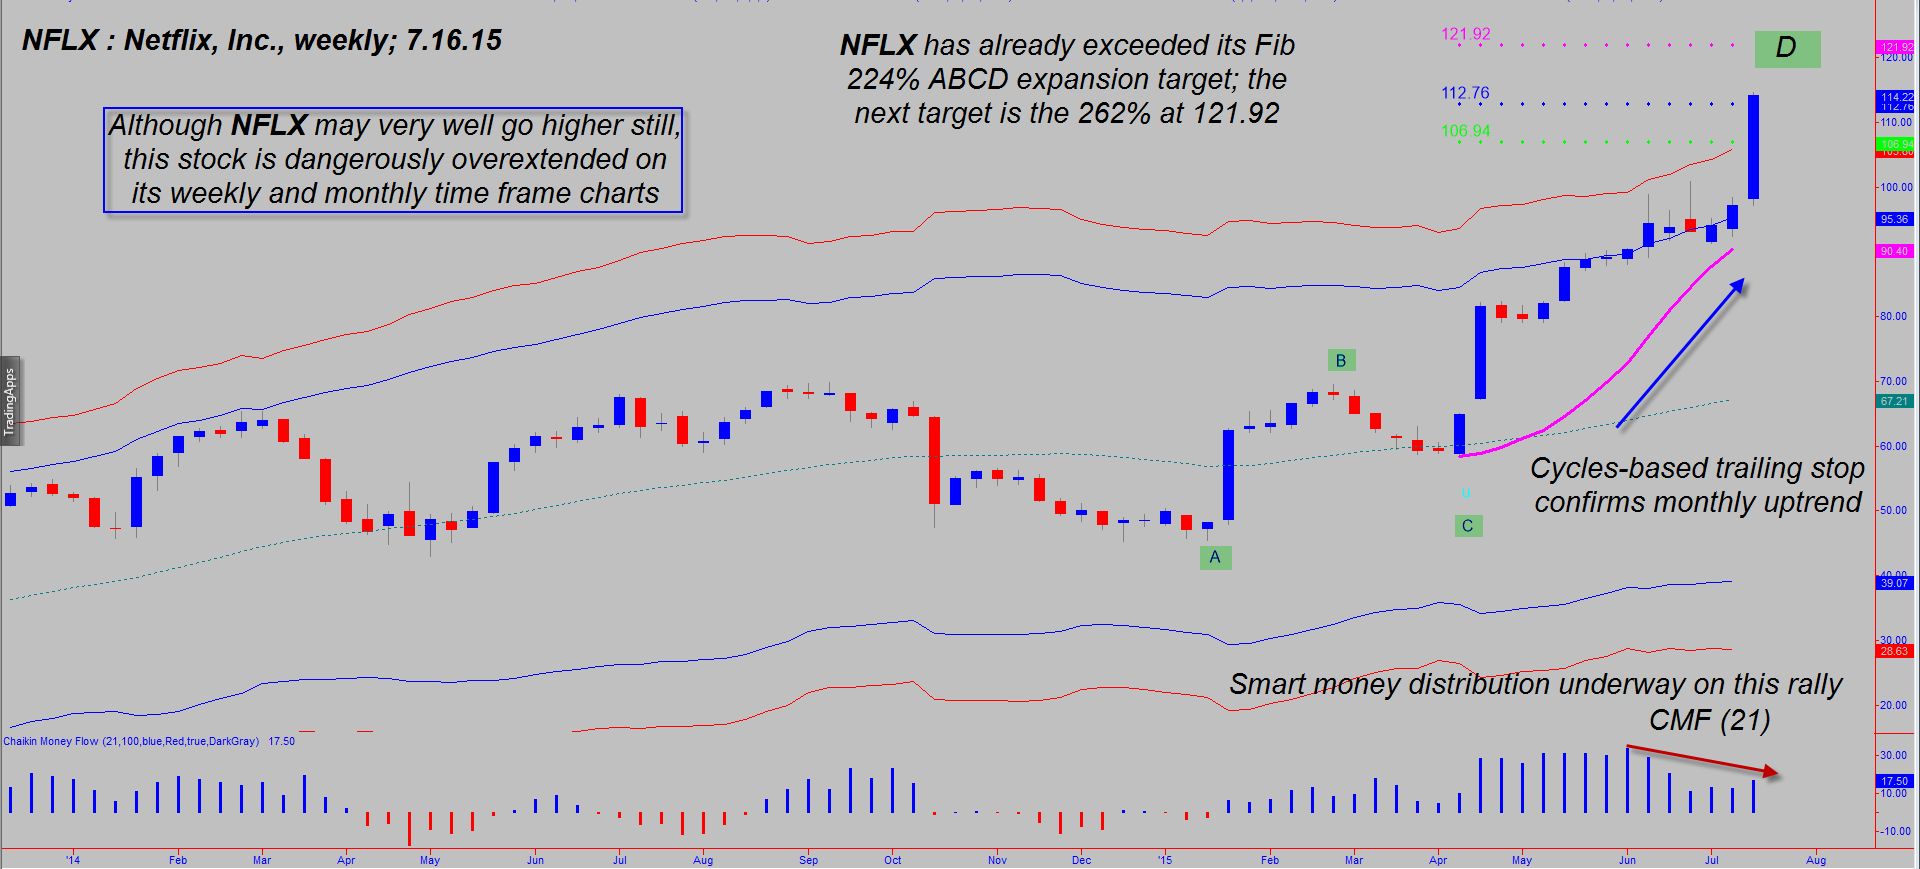
| Netflix, Inc. (NFLX) recently announced a one for seven stock split and right after that revealed that its global subscriber base had swelled to more than 65 million; as of this writing (July 16, 2015), NFLX is up by nearly 17% this week alone and is on a literal bullish tear that is among the strongest ever seen on this high-profile large cap issue. However, the stock has already exceeded several statistical resistance levels on its monthly and weekly time frames, and the warning is clear that substantial profit-taking is about to erupt soon. Here's a look at NFLX, using Keltner bands, money flow, and cycle timing tools (Figure 1). |
|
| Figure 1. Weekly Chart Of Netflix, Inc. (NFLX). The "smart money" has been selling out of this stock for the past six weeks, meaning that its latecomer retail traders who are doing the bulk of the buying now. Look out below as a correction ensues. |
| Graphic provided by: TradeStation. |
| Graphic provided by: ProfitTrader 7 by www.walterbressert.com. |
| |
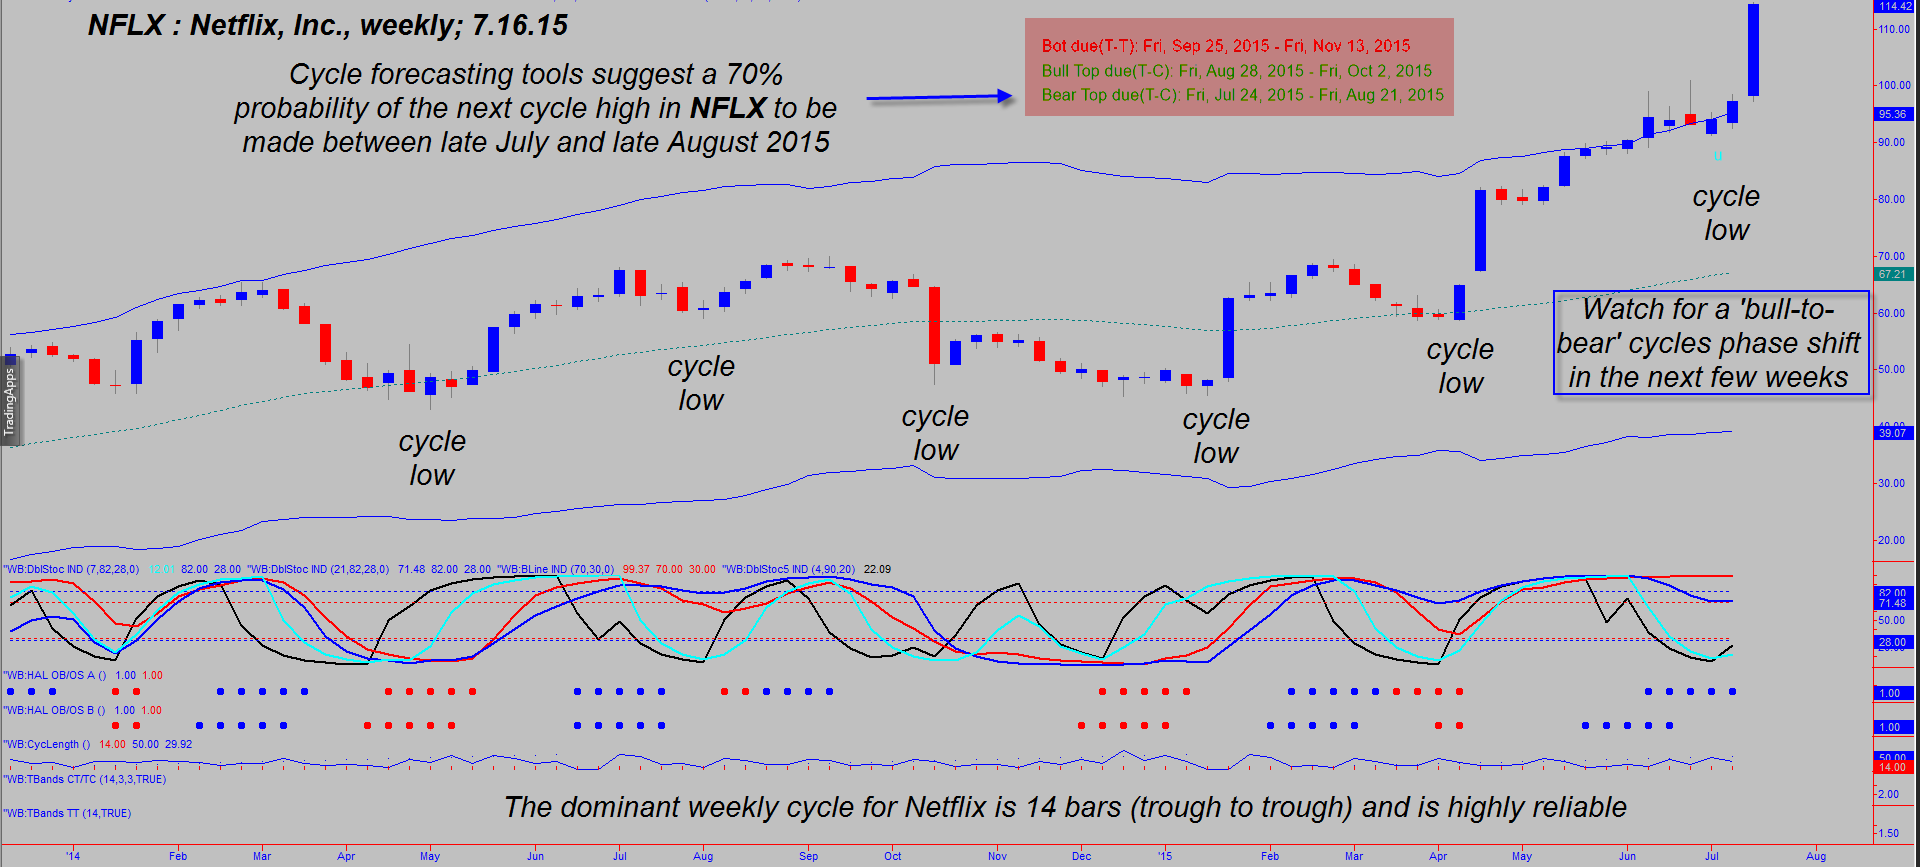
| The analysis presented requires no college degree to understand, nor is it based on arcane technical studies. It's simply based on common sense as we examine how this combination of technicals all come to the same conclusion, which is that NFLX is about to experience significant profit taking after enjoying such windfall gains in recent months. 1. Long-term money flow clearly suggests distribution by the "smart money" interests in the market — note the dramatically lower peak on the Chaikin money flow (CMF)(21) histogram. 2. NFLX is at/near a significant Fibonacci ABCD 224% swing target price at 112.76; the next target is the 262% at 121.92. 3. NFLX is trading far above both of the already extreme upper Keltner bands — this stock never spends much time trading above the upper red band, with a correction always following soon after. 4. The monthly chart of NFLX (not shown) shows the same dynamics at work — price is above the top red band and long-term money flow clearly confirms smart money distribution during the recent strong rally phases. This means that retail traders are now jumping in, pushing NFLX to one final high before a significant pullback occurs this summer. 5. Cycle timing tools become valuable when used in concert with the aforementioned distribution and support & resistance patterns are confirmed; in this case, we find that NFLX has a dominant and reliable 14-week trading cycle (trough to trough basis) and that it is only three weeks into the current bullish cycle upswing (Figure 2). However, given that the stock is massively overstretched at a time of confirmed distribution, the most prudent cycles analyst will use the bearish forecast to determine the time window for the ultimate cycle high. Since a bearish cycle will only rise one to five weeks before the higher degree trend forces prices lower, wise traders will be on the lookout for bearish trend reversal patterns in NFLX, such as take outs of daily cycle lows, two-bar reversal patterns, and daily candle chart reversal patterns. |
|
| Figure 2. Cycles. The stock has a well-defined, highly reliable 14-bar dominant price cycle on its weekly time frame. Watch for a bull-to-bear cycle phase shift in coming weeks. |
| Graphic provided by: TradeStation. |
| Graphic provided by: ProfitTrader 7 by www.walterbressert.com. |
| |
| Any reader who is currently long NFLX since April 2015 should be taking at least some gains off the table and running a trailing stop that matches their personal profit target/risk control parameters. Once the last of the "greater fools" buys in at the exact top (exact time and price being unknowable, of course), NFLX will make a proportional correction, possibly back inside both of the top Keltner bands (96.00-105.00 range) before the big buyers step back in to buy. I view this latest rally in NFLX as yet another confirmation of a fast-approaching multiyear US stock market high, much like we saw in 1973, 1987, 2000 and 2007. If this assessment is accurate, then we may expect to see declines of 40-60% in the S&P 500, Nasdaq 100, and Dow 30 Industrials within the next two to three years. Small caps could fall even more dramatically as China's entire house of cards economy continues to implode. Now more than ever, trade wisely until we meet here again. |
Freelance financial markets writer and online publisher of the Trendzetterz.com S&P 500 Weekly Forecast service.
| Title: | Market consultant and writer |
| Company: | Trendzetterz |
| Address: | 81 Hickory Hollow Drive |
| Crossville, TN 38555 | |
| Phone # for sales: | 904-303-4814 |
| Website: | trendzetterz.com |
| E-mail address: | support@trendzetterz.com |
Traders' Resource Links | |
| Trendzetterz has not added any product or service information to TRADERS' RESOURCE. | |
Click here for more information about our publications!
PRINT THIS ARTICLE

Request Information From Our Sponsors
- VectorVest, Inc.
- Executive Premier Workshop
- One-Day Options Course
- OptionsPro
- Retirement Income Workshop
- Sure-Fire Trading Systems (VectorVest, Inc.)
- Trading as a Business Workshop
- VectorVest 7 EOD
- VectorVest 7 RealTime/IntraDay
- VectorVest AutoTester
- VectorVest Educational Services
- VectorVest OnLine
- VectorVest Options Analyzer
- VectorVest ProGraphics v6.0
- VectorVest ProTrader 7
- VectorVest RealTime Derby Tool
- VectorVest Simulator
- VectorVest Variator
- VectorVest Watchdog
- StockCharts.com, Inc.
- Candle Patterns
- Candlestick Charting Explained
- Intermarket Technical Analysis
- John Murphy on Chart Analysis
- John Murphy's Chart Pattern Recognition
- John Murphy's Market Message
- MurphyExplainsMarketAnalysis-Intermarket Analysis
- MurphyExplainsMarketAnalysis-Visual Analysis
- StockCharts.com
- Technical Analysis of the Financial Markets
- The Visual Investor