HOT TOPICS LIST
- MACD
- Fibonacci
- RSI
- Gann
- ADXR
- Stochastics
- Volume
- Triangles
- Futures
- Cycles
- Volatility
- ZIGZAG
- MESA
- Retracement
- Aroon
INDICATORS LIST
LIST OF TOPICS
PRINT THIS ARTICLE
by Chaitali Mohile
Vector Group Ltd is a stock to buy on the dip.
Position: Buy
Chaitali Mohile
Active trader in the Indian stock markets since 2003 and a full-time writer. Trading is largely based upon technical analysis.
PRINT THIS ARTICLE
TECHNICAL ANALYSIS
VGR - A Strong Stock
07/21/15 12:36:03 PMby Chaitali Mohile
Vector Group Ltd is a stock to buy on the dip.
Position: Buy
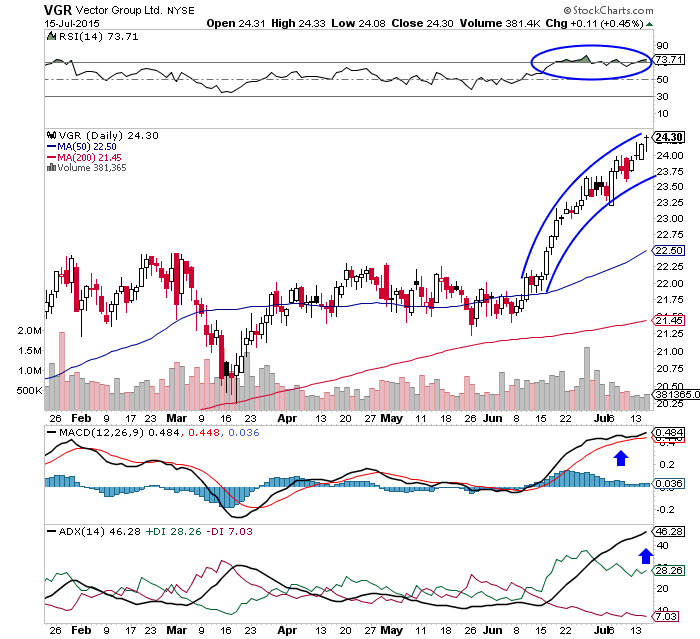
| Vector Group Ltd (VGR) has ignored all the current turbulences in the financial market. The stock is strongly heading upward. Although the entire market was shaky for the past few weeks, VGR turned marginally volatile but continued its upward rally. On the daily chart in Figure 1 the small candles with small upper shadows reflected the lack of strength to sustain at an intraday high. There are a few red candles as well, which are indicating bad or negative days for the stock. However, the buyer's confidence protected the stock from losing its bullish momentum. |
| The 14-period relative strength index (RSI) can remain extremely overbought or oversold for the longer period without harming the ongoing rally. In Figure 1, the strength indicator is overbought for just a month and half, so the current upward price action will move in lower gear. The uptrend indicated by the average directional index (ADX)(14) has reached overheated levels above 40 and the moving average convergence/divergence (MACD) 12,26,9) is comfortably moving in positive territory. Hence, VGR shows healthy signs of bullishness. |

|
| Figure 1. Daily Chart Of Victor Group, Ltd. (VGR). The healthy bullish indicators suggested and confirmed strength in the rally. |
| Graphic provided by: StockCharts.com. |
| |
| On the weekly chart in Figure 2, all three indicators were moving against the price rally for a year and half. The RSI(14), the MACD(12,26,9) and the ADX(14) formed lower highs but the stock continued its ascent. The negative divergence indicated slight weakness in the stock. As a result, VGR dropped from the higher highs but established support immediately. This price movement shows the strength in the stock. Therefore, VGR is a stock that can be bought on dips and preserved in the portfolio. Currently, the indicators are rising from the lows of their respective bullish areas, suggesting fresh buying opportunity. |

|
| Figure 2. Weekly Chart Of VGR. An ascending channel would be a good pattern to follow when trading a long position. |
| Graphic provided by: StockCharts.com. |
| |
| In addition, traders and investors can also consider a breakout of an ascending channel formed by higher highs and higher lows (Figure 2). Since the ADX(14) has not yet shifted in the developing uptrend area above the 20 levels, VGR is likely to turn downwards from the upper trendline resistance of the channel. Traders can grab this opportunity for entering the long trade with the stop-loss below the lower trendline support. The 50-day moving average (MA) would be an additional support for the rally. In the meantime, the bullish RSI(14) and the bullish crossover of the MACD(12,26,9) should boost the confidence of the existing buyers, sustaining the strength in the rally. |
| Considering both the charts (daily and weekly), VGR is a strong stock even in volatile market conditions. Buying on dips would be a good trading strategy for VGR. |
Active trader in the Indian stock markets since 2003 and a full-time writer. Trading is largely based upon technical analysis.
| Company: | Independent |
| Address: | C1/3 Parth Indraprasth Towers. Vastrapur |
| Ahmedabad, Guj 380015 | |
| E-mail address: | chaitalimohile@yahoo.co.in |
Traders' Resource Links | |
| Independent has not added any product or service information to TRADERS' RESOURCE. | |
Click here for more information about our publications!
PRINT THIS ARTICLE

Request Information From Our Sponsors
- StockCharts.com, Inc.
- Candle Patterns
- Candlestick Charting Explained
- Intermarket Technical Analysis
- John Murphy on Chart Analysis
- John Murphy's Chart Pattern Recognition
- John Murphy's Market Message
- MurphyExplainsMarketAnalysis-Intermarket Analysis
- MurphyExplainsMarketAnalysis-Visual Analysis
- StockCharts.com
- Technical Analysis of the Financial Markets
- The Visual Investor
- VectorVest, Inc.
- Executive Premier Workshop
- One-Day Options Course
- OptionsPro
- Retirement Income Workshop
- Sure-Fire Trading Systems (VectorVest, Inc.)
- Trading as a Business Workshop
- VectorVest 7 EOD
- VectorVest 7 RealTime/IntraDay
- VectorVest AutoTester
- VectorVest Educational Services
- VectorVest OnLine
- VectorVest Options Analyzer
- VectorVest ProGraphics v6.0
- VectorVest ProTrader 7
- VectorVest RealTime Derby Tool
- VectorVest Simulator
- VectorVest Variator
- VectorVest Watchdog
