HOT TOPICS LIST
- MACD
- Fibonacci
- RSI
- Gann
- ADXR
- Stochastics
- Volume
- Triangles
- Futures
- Cycles
- Volatility
- ZIGZAG
- MESA
- Retracement
- Aroon
INDICATORS LIST
LIST OF TOPICS
PRINT THIS ARTICLE
by Koos van der Merwe
One rule I have is not to buy a stock that is newly listed. Instead, I wait for a year to see if a trend has been built.
Position: Hold
Koos van der Merwe
Has been a technical analyst since 1969, and has worked as a futures and options trader with First Financial Futures in Johannesburg, South Africa.
PRINT THIS ARTICLE
TECHNICAL ANALYSIS
Do You Buy Fitbit, Inc.?
07/16/15 04:42:02 PMby Koos van der Merwe
One rule I have is not to buy a stock that is newly listed. Instead, I wait for a year to see if a trend has been built.
Position: Hold
| Buying a stock that is newly listed on the stock market is risky because there is not enough history to analyze the share price with technical analysis. There are, however, occasions when it is risky, and Facebook, Inc. (FB) is the perfect example, where the stock price on May 18, 2012, the day the share was listed, hit a high of $45, and then promptly started dropping, reaching a low of $17.55 by September 4, 2012. Of course you would have been stopped out, and it would have been gutsy to buy back in, but look at Facebook's price on July 16, 2015. It is trading above $90, with a nice and comfortable profit had you held the share. So, is it worth buying Fitbit, Inc. (FIT) at its current price, and relying on emotion and love of a product above technical analysis? |

|
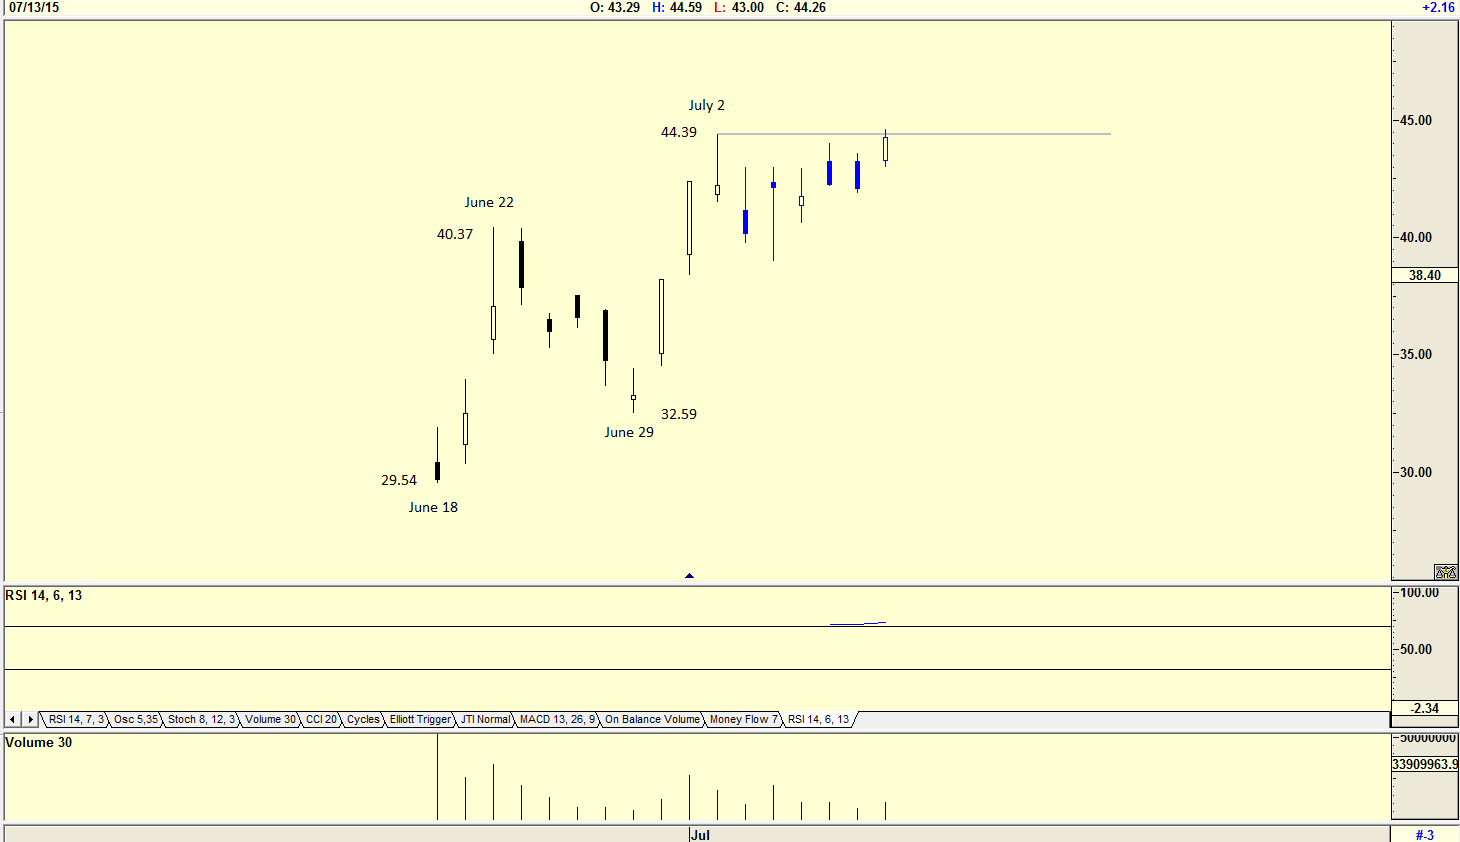
| Figure 1. Daily Chart Of Fitbit (FIT). Here you see how price moved from the day it was listed. |
| Graphic provided by: AdvancedGET. |
| |
| The chart in Figure 1 is a daily chart showing how the price moved from the day it was listed. The share price rose from $29.54 on June 18, 2015 to $40.37 by June 22, 2015 and then fell to $32.59 by June 29, 2015 as those who believed in the stock took comfortable profits. From that low, the share price jumped in three days to $44.39 by July 2, 2015 and has been consolidating. The chart shows the evidence of a relative strength index (RSI) at oversold levels. Note also that volume rose with the recent rise in the share price, a sign of strength. |

|
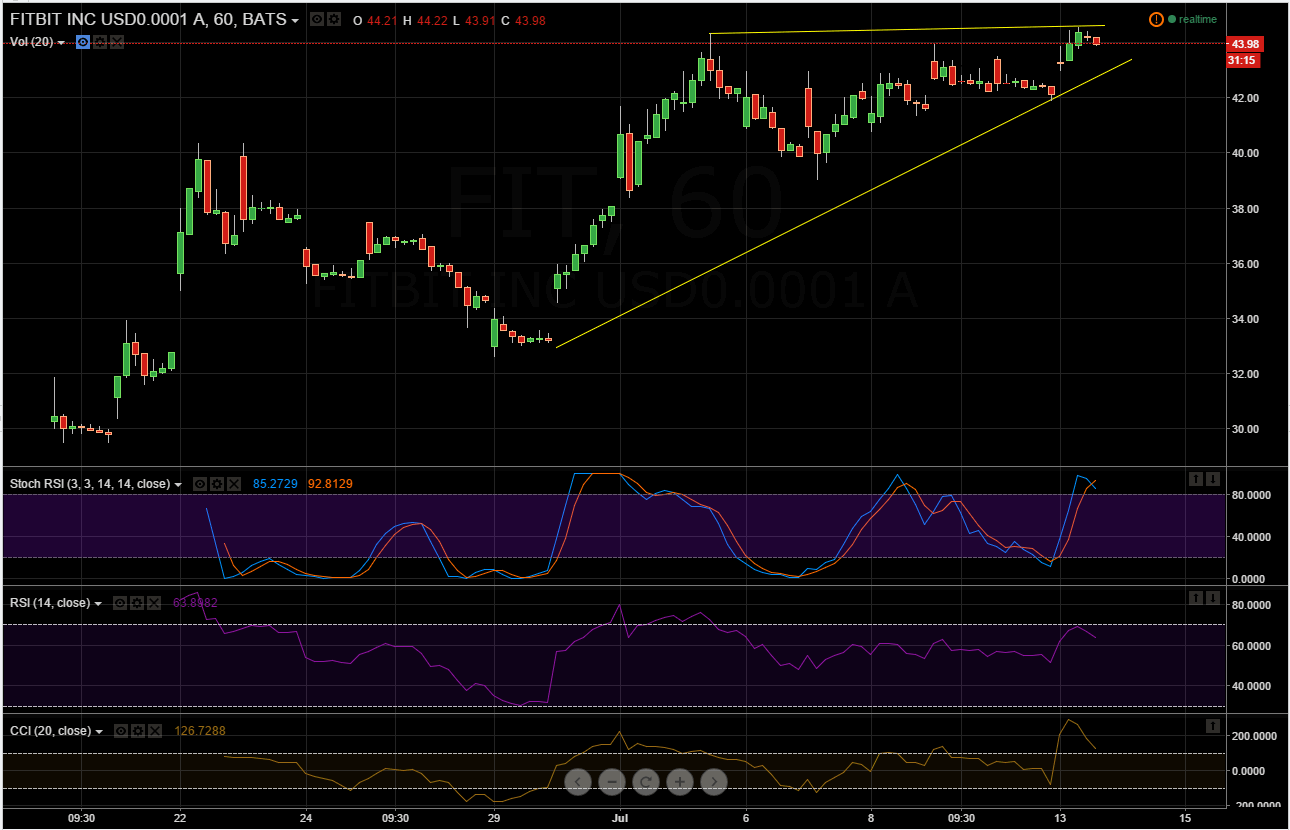
| Figure 2. Hourly Chart Of FIT. You want to wait for the indicators to be oversold before entering a long position. You also want price to move above a resistance line. |
| Graphic provided by: Tradingview.com. |
| |
| The chart in Figure 2 is a one-hour chart showing how the share price has moved. Note the indicators which are all overbought. So, if you are still interested in buying, wait for the indicators to be oversold. Note also the resistance line, a move above which could suggest a buy. |

|
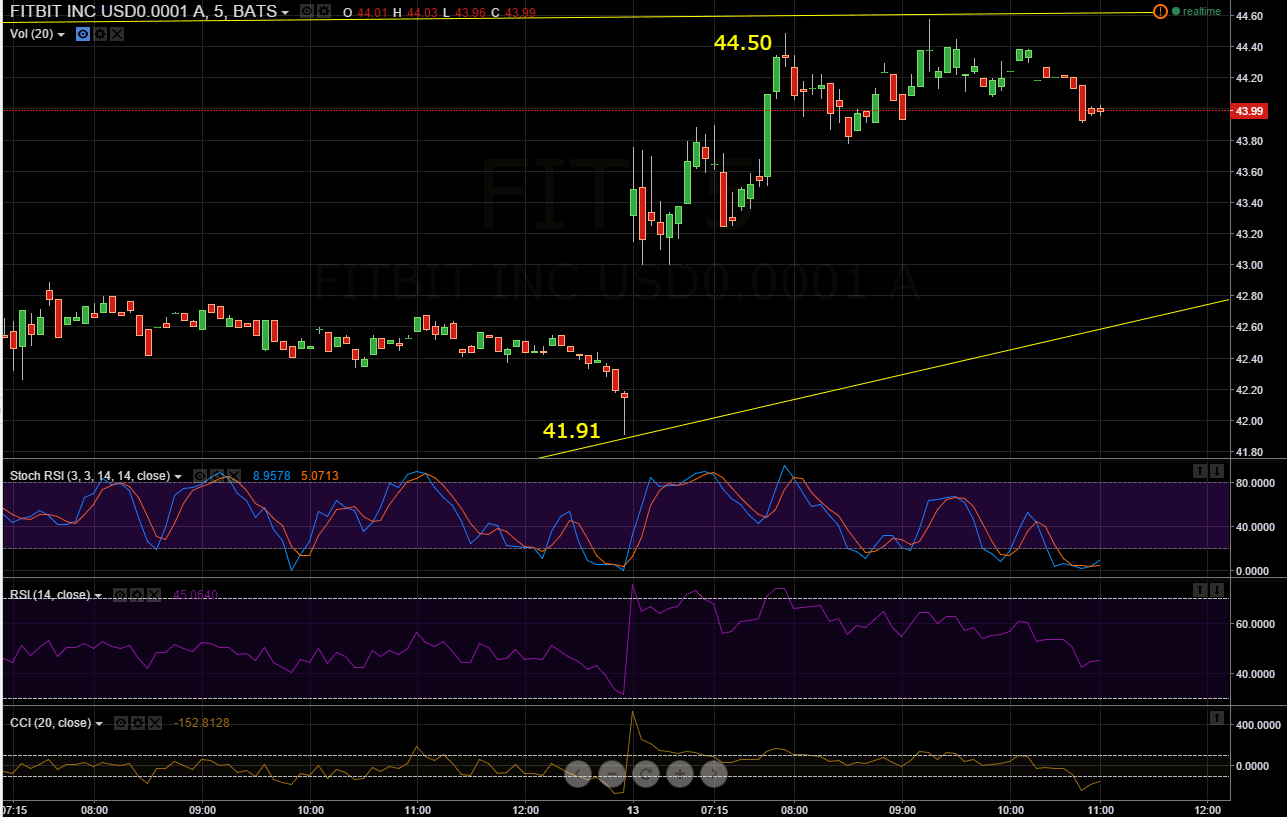
| Figure 3. Five-Minute Chart Of FIT. Here the stochastic RSI is oversold and suggesting a buy. So is the CCI but the RSI is not yet at oversold levels. |
| Graphic provided by: Tradingview.com. |
| |
| Finally, you could look at a five-minute chart (Figure 3), where the stochastic RSI is oversold and suggesting a buy as is the CCI indicator, but the RSI is not yet at oversold levels. The chart also shows how the price jumped to a high of $44.50 from the low of $41.91 after the market opened, and has since been trading in a sideways pattern. Of course, the chart shows a gap, which by all accounts should be filled. Would I be a buyer of FIT? I must admit that it is tempting, but being on the cautious side, I shall keep an eye on the five-minute chart looking for a move above $44.50. Then, if I decide to buy, I will prefer to buy an in-the-money call option, as a LEAP. This way I will have put out less money on a risky but possibly profitable trade. |
Has been a technical analyst since 1969, and has worked as a futures and options trader with First Financial Futures in Johannesburg, South Africa.
| Address: | 3256 West 24th Ave |
| Vancouver, BC | |
| Phone # for sales: | 6042634214 |
| E-mail address: | petroosp@gmail.com |
Click here for more information about our publications!
Comments

Request Information From Our Sponsors
- VectorVest, Inc.
- Executive Premier Workshop
- One-Day Options Course
- OptionsPro
- Retirement Income Workshop
- Sure-Fire Trading Systems (VectorVest, Inc.)
- Trading as a Business Workshop
- VectorVest 7 EOD
- VectorVest 7 RealTime/IntraDay
- VectorVest AutoTester
- VectorVest Educational Services
- VectorVest OnLine
- VectorVest Options Analyzer
- VectorVest ProGraphics v6.0
- VectorVest ProTrader 7
- VectorVest RealTime Derby Tool
- VectorVest Simulator
- VectorVest Variator
- VectorVest Watchdog
- StockCharts.com, Inc.
- Candle Patterns
- Candlestick Charting Explained
- Intermarket Technical Analysis
- John Murphy on Chart Analysis
- John Murphy's Chart Pattern Recognition
- John Murphy's Market Message
- MurphyExplainsMarketAnalysis-Intermarket Analysis
- MurphyExplainsMarketAnalysis-Visual Analysis
- StockCharts.com
- Technical Analysis of the Financial Markets
- The Visual Investor
