

HOT TOPICS LIST
- MACD
- Fibonacci
- RSI
- Gann
- ADXR
- Stochastics
- Volume
- Triangles
- Futures
- Cycles
- Volatility
- ZIGZAG
- MESA
- Retracement
- Aroon
INDICATORS LIST
LIST OF TOPICS
PRINT THIS ARTICLE
by Chaitali Mohile
Genuine Parts Co. is going through a trend reversal rally.
Position: Sell
Chaitali Mohile
Active trader in the Indian stock markets since 2003 and a full-time writer. Trading is largely based upon technical analysis.
PRINT THIS ARTICLE
TECHNICAL INDICATORS
GPC - A Low Risk Trading Opportunity
07/13/15 03:24:09 PMby Chaitali Mohile
Genuine Parts Co. is going through a trend reversal rally.
Position: Sell
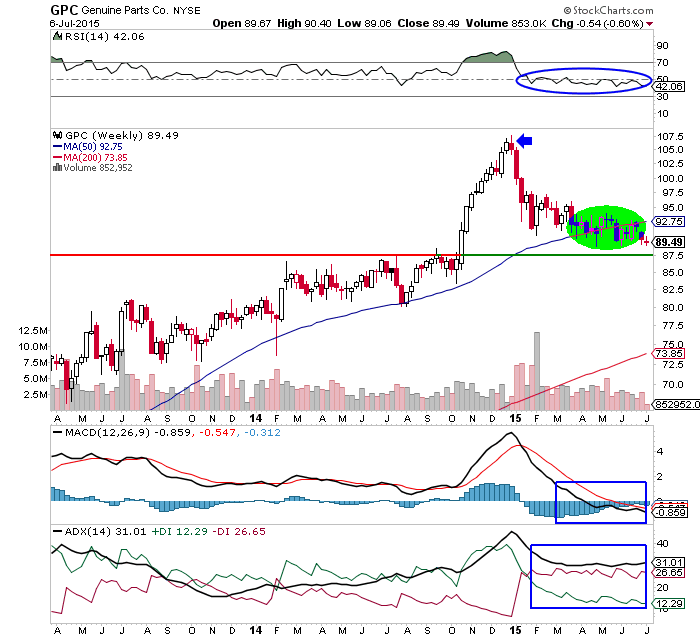
| Genuine Parts Co. (GPC) was in a long-term uptrend. The stock has witnessed a strong bull run for many years, offering handsome profits to its investors. This stock is best suited for long and medium investors. The rally reached its all-time high at $107.50 in December 2014. During this entire rally, the technical indicators used in the weekly chart in Figure 1 turned highly overbought. As a result, the bullish rally paused and entered a trend reversal phase. The average directional index (ADX)(14) reached an extremely overheated level at 60, suggesting a fresh bullish trend reversal rally. |
|
| Figure 1. Weekly Chart Of Genuine Parts Co. (GPC). The rally is heading toward the psychological support at $87.50. |
| Graphic provided by: StockCharts.com. |
| |
| Accordingly, the ADX(14), a highly overbought relative strength index (RSI)(14) and an extremely positive moving average convergence/divergence (MACD)(12,26,9) began a new descending journey in January 2015. The price rally on the price chart in Figure 1 started plunging from the top near $107.5 levels. Initially, the fresh bearish rally witnessed a huge selling pressure. The size of the two red candlesticks on the price chart in Figure 1 shows bearish pressure on the price rally. Meanwhile, all the three indicators also dropped from the extreme levels, controlling the further fall in price. |
| Later, GPC turned volatile as price approached the 50-day moving average (MA) support. It was the first major technical support of the stock. However, the price continued its downwards move, breaching the MA support marginally. A fresh downtrend, the shaky RSI(14) and the negative MACD(12,26,9) are highlighting more downside for GPC. Currently, the stock is trading below the newly formed MA resistance. The next psychological support is at the $87.50 level. Therefore, the stock should continue its bearish journey. |
|
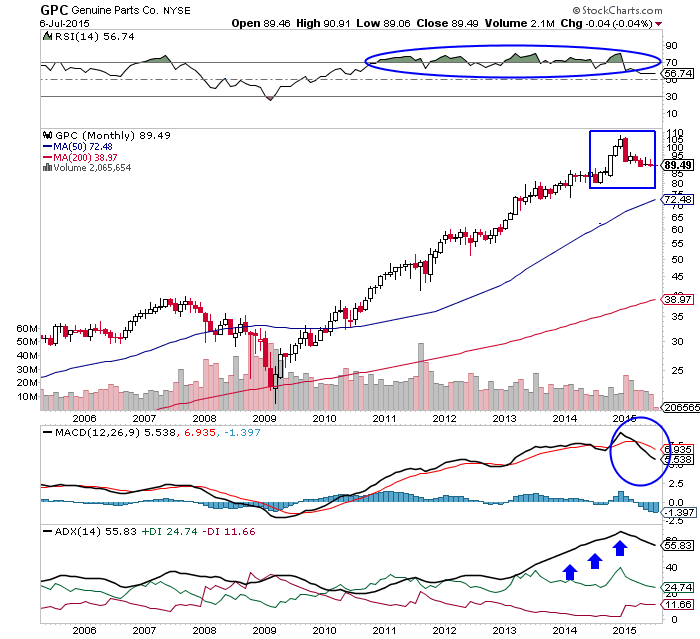
| Figure 2. Monthly Chart Of GPC. Due to extremely bullish conditions suggested by the technical indicators, the stock is undergoing short-term trend reversal rally. |
| Graphic provided by: StockCharts.com. |
| |
| The monthly time chart in Figure 2 shows that the RSI(14) was overbought for almost four years. However, the steady uptrend and the ascending MACD line dragged the stock upward. The stock formed a top as the trend indicator and momentum indicator turned overheated. The bullish price rally reversed from $107.50 levels on these overbought conditions. The doji candlesticks reflect that the stock is still under bearish pressure; therefore, any relief rally is unlikely to occur in the near future. In addition, the ADX(14) is still overheated and the MACD(12,26,9) is showing a bearish crossover in positive territory. The RSI(14) is moving closer to the center line at 50 levels. |
| Thus, GPC is undergoing a technical correction which has opened a good short trading opportunity for traders. A new short selling position can be triggered from the current levels, and those already short can hold the trade. Both trades can be continued until a confirmed reversal signal appears on the indicators. To conclude, GPC is a low risk tradable stock in the current volatile market. |
Active trader in the Indian stock markets since 2003 and a full-time writer. Trading is largely based upon technical analysis.
| Company: | Independent |
| Address: | C1/3 Parth Indraprasth Towers. Vastrapur |
| Ahmedabad, Guj 380015 | |
| E-mail address: | chaitalimohile@yahoo.co.in |
Traders' Resource Links | |
| Independent has not added any product or service information to TRADERS' RESOURCE. | |
Click here for more information about our publications!
PRINT THIS ARTICLE

Request Information From Our Sponsors
- StockCharts.com, Inc.
- Candle Patterns
- Candlestick Charting Explained
- Intermarket Technical Analysis
- John Murphy on Chart Analysis
- John Murphy's Chart Pattern Recognition
- John Murphy's Market Message
- MurphyExplainsMarketAnalysis-Intermarket Analysis
- MurphyExplainsMarketAnalysis-Visual Analysis
- StockCharts.com
- Technical Analysis of the Financial Markets
- The Visual Investor
- VectorVest, Inc.
- Executive Premier Workshop
- One-Day Options Course
- OptionsPro
- Retirement Income Workshop
- Sure-Fire Trading Systems (VectorVest, Inc.)
- Trading as a Business Workshop
- VectorVest 7 EOD
- VectorVest 7 RealTime/IntraDay
- VectorVest AutoTester
- VectorVest Educational Services
- VectorVest OnLine
- VectorVest Options Analyzer
- VectorVest ProGraphics v6.0
- VectorVest ProTrader 7
- VectorVest RealTime Derby Tool
- VectorVest Simulator
- VectorVest Variator
- VectorVest Watchdog