HOT TOPICS LIST
- MACD
- Fibonacci
- RSI
- Gann
- ADXR
- Stochastics
- Volume
- Triangles
- Futures
- Cycles
- Volatility
- ZIGZAG
- MESA
- Retracement
- Aroon
INDICATORS LIST
LIST OF TOPICS
PRINT THIS ARTICLE
by Koos van der Merwe
The past few weeks have been stressful with the anticipation of Greece leaving the European Union.
Position: Accumulate
Koos van der Merwe
Has been a technical analyst since 1969, and has worked as a futures and options trader with First Financial Futures in Johannesburg, South Africa.
PRINT THIS ARTICLE
TECHNICAL ANALYSIS
The Possibility Of Grexit
07/08/15 03:33:55 PMby Koos van der Merwe
The past few weeks have been stressful with the anticipation of Greece leaving the European Union.
Position: Accumulate
| The only thing Greece and Germany have in common is the 'G' in their names. To expect Greece to operate economically like Germany is asking for a miracle. Many argue that Greece should exit from the euro and that it would solve its economic problems by having its own currency which it would devalue if and when necessary. Others argue that should Greece leave the euro and European Union, it would mark the start of the breakup of the euro and European Union. However, you should remember that the United Kingdom and Denmark are members of the European Union but retain the British pound and Swedish krone as their currency. And so the argument and discussion goes around and around. However, you can never forget Ben Bernanke's economic policy when things got tough in the United States. He simply printed dollars, and as long as the inflation rate remained constant, continued to print dollars, hence his nickname, Helicopter Ben. So, perhaps the solution to Greece's problems is Ben Bernanke's strategy. Whatever happens in Europe though, the world is affected. The US and Canadian markets have fallen heavily, a correction that was expected, but what the cause would be was unknown. So, when will it end? When will the markets start rising again? |

|
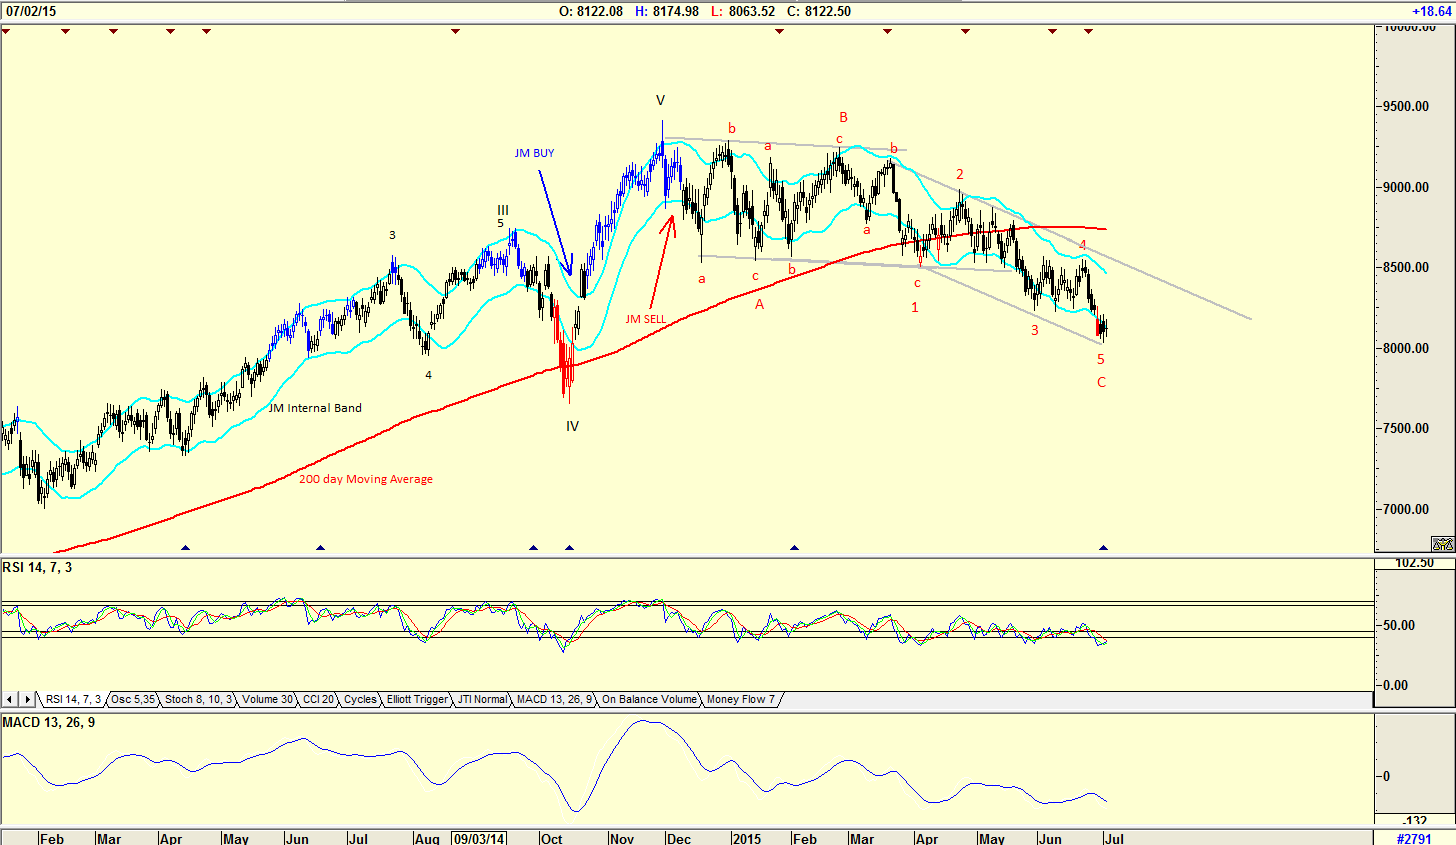
| Figure 1. Daily Chart Of The Dow Jones Transportation Index. The Elliott wave count suggests that the index could have completed an ABC correction and could start rising. |
| Graphic provided by: AdvancedGET. |
| |
| The chart in Figure 1 is a daily chart of the Dow Transportation index. The chart shows an Elliott wave count suggesting that the index could have completed an ABC correction and could start rising in the near future. The index has also fallen possibly too far below the 200-day moving average, another indication that a correction could occur. The relative strength index (RSI) and the moving average convergence/divergence (MACD) have not been helpful. The JM internal band is still in sell mode. The JM internal band is a 15-period moving average offset by 2% positive and 2% negative. A move above the upper band suggests a buy and below the lower band a sell. |

|
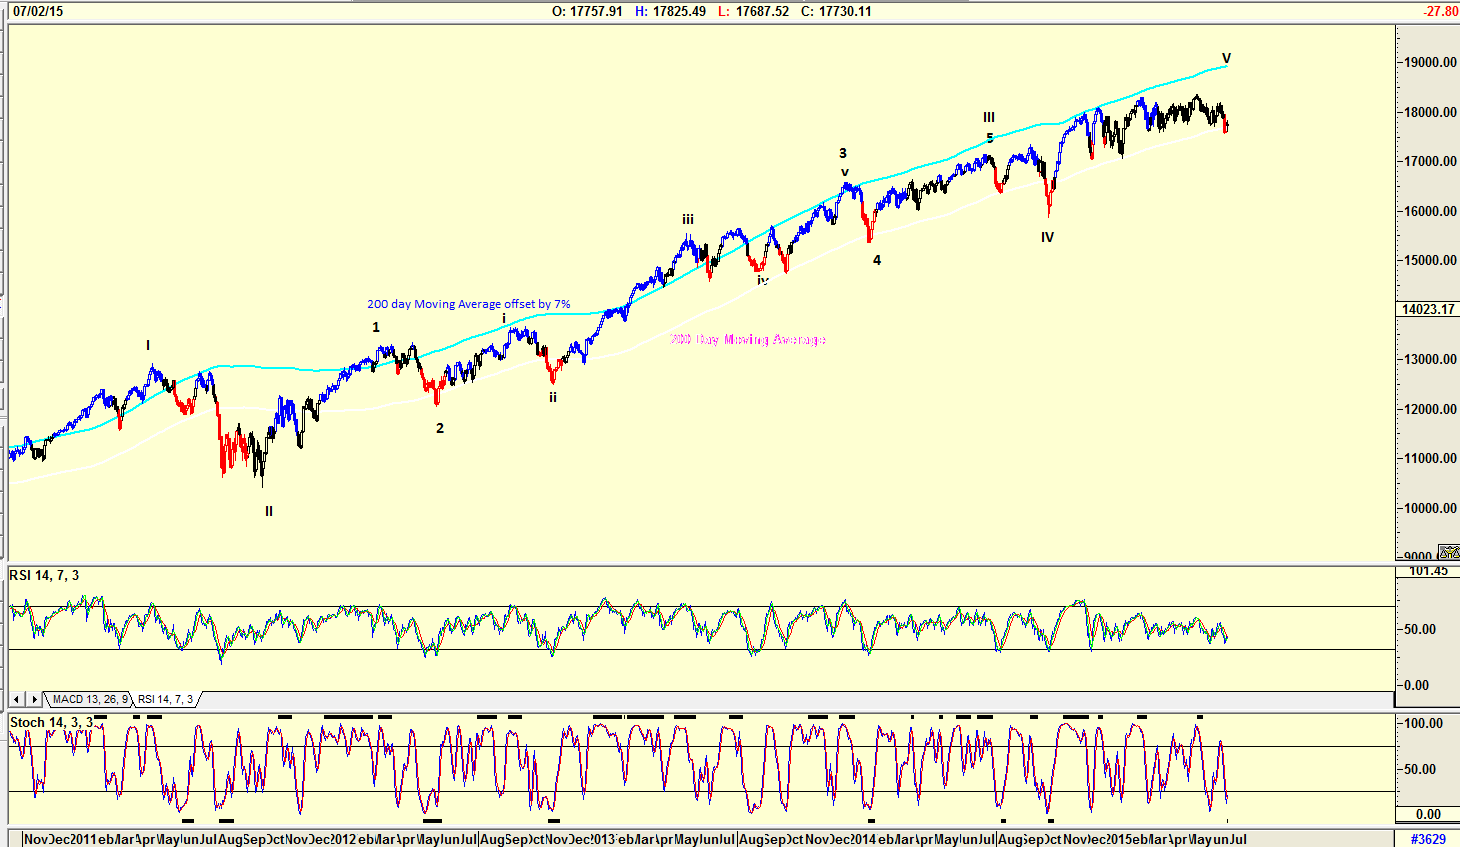
| Figure 2. Daily Chart Of The Dow Jones Industrial Average. The DJIA is presently testing its 200-day moving average and could start rising soon. |
| Graphic provided by: AdvancedGET. |
| |
| The chart in Figure 2 is a daily chart of the Dow Jones showing its movement around the 200-day moving average. The Elliott wave count shown could vary — you should never forget that an Elliott wave is a signpost in the wilderness, and can change at the next signpost a little way down the road. The Dow is presently testing the 200-day moving average and could start rising soon, Once again both indicators are not suggesting a clear direction. |

|
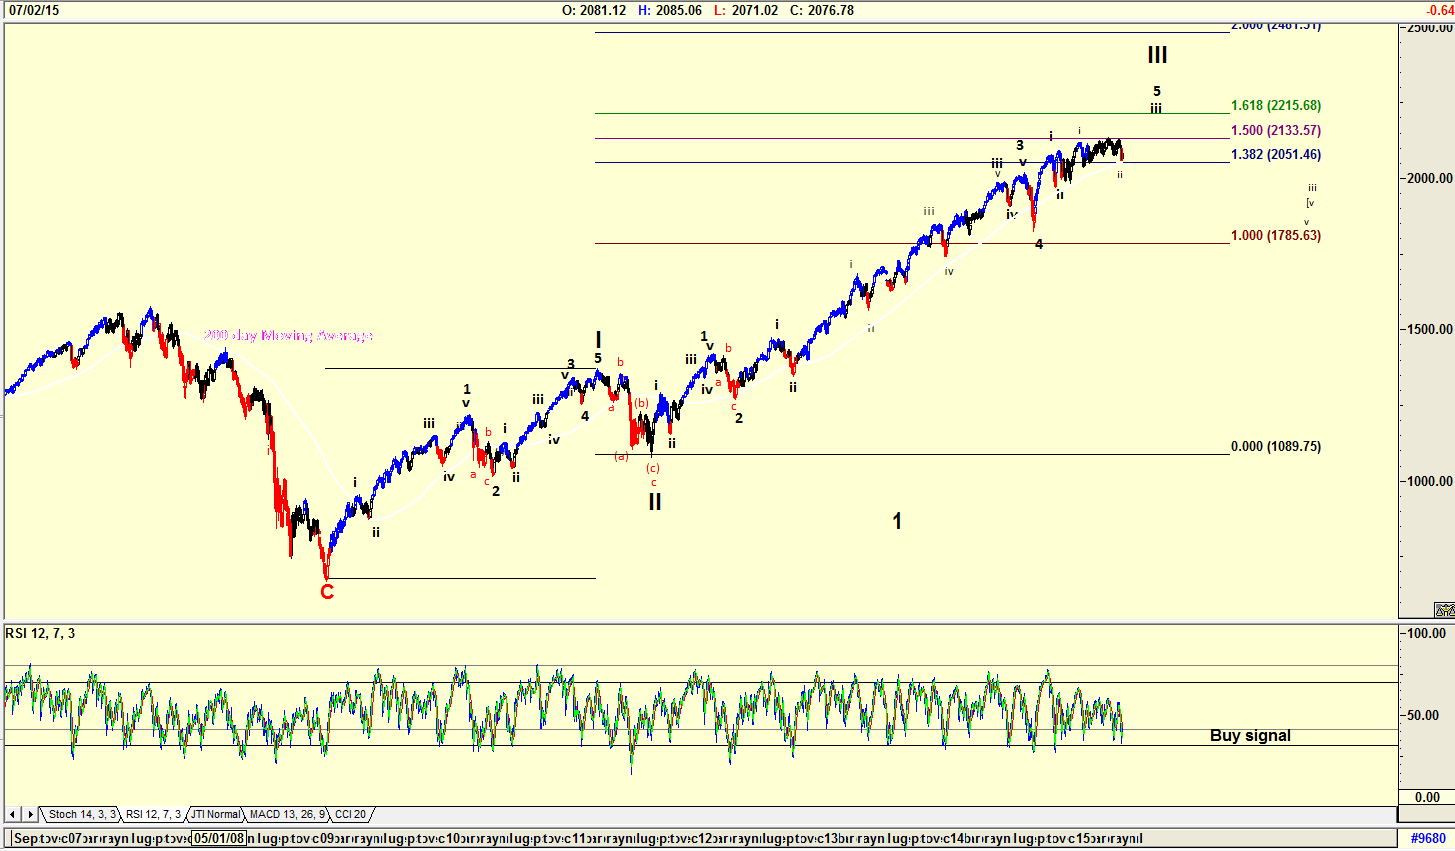
| Figure 3. Daily Chart Of The S&P 500 Index. The S&P 500 is testing its 200-day moving average. The Fibonacci extension suggests the index is testing the 1.50 extension and the Elliott wave count suggests that the index could rise further. |
| Graphic provided by: AdvancedGET. |
| |
| The S&P 500 index in Figure 3 shows it testing the 200-day moving average, but also shows a Fibonacci extension with the index testing the 1.50 extension. The Elliott wave count also differs from that of the Dow and Dow Transport indexes, suggesting that the index could still rise further into a Wave 5 of WAVE III. |

|
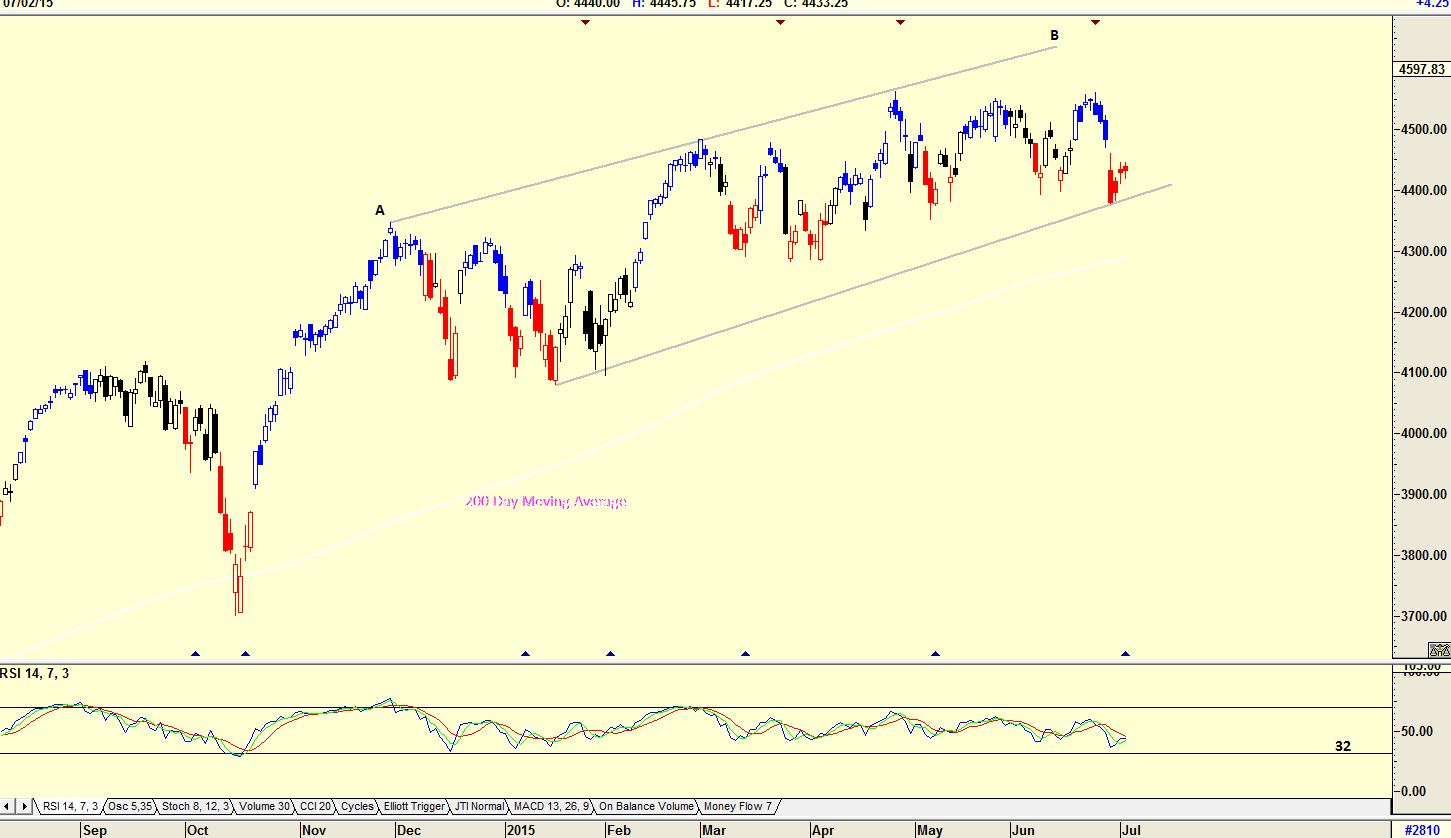
| Figure 4. Daily Chart Of The Nasdaq 100 Index. The Nasdaq has found support on a trendline and the RSI is still trending down. |
| Graphic provided by: AdvancedGET. |
| |
| The chart in Figure 4 is a daily chart of the Nasdaq with the 200-day moving average. Note that the index has not fallen to the 200-day moving average, but has found support on a trend line drawn parallel to the resistance line A-B. Note also that the RSI is still trending down and has not fallen below the 32 horizontal line. Is the market bottoming and will it start rising as the Greece crises resolves itself, or will the financial problems of Portugal, Spain, and Italy weigh heavily on investors? Is the solution to Greece's problem simply to do what England and Denmark did, namely be a part of the European Union but have its own currency? Personally, I believe that Greece should have its own currency. Ben Bernanke's strategy could work. |
Has been a technical analyst since 1969, and has worked as a futures and options trader with First Financial Futures in Johannesburg, South Africa.
| Address: | 3256 West 24th Ave |
| Vancouver, BC | |
| Phone # for sales: | 6042634214 |
| E-mail address: | petroosp@gmail.com |
Click here for more information about our publications!
Comments

|

Request Information From Our Sponsors
- StockCharts.com, Inc.
- Candle Patterns
- Candlestick Charting Explained
- Intermarket Technical Analysis
- John Murphy on Chart Analysis
- John Murphy's Chart Pattern Recognition
- John Murphy's Market Message
- MurphyExplainsMarketAnalysis-Intermarket Analysis
- MurphyExplainsMarketAnalysis-Visual Analysis
- StockCharts.com
- Technical Analysis of the Financial Markets
- The Visual Investor
- VectorVest, Inc.
- Executive Premier Workshop
- One-Day Options Course
- OptionsPro
- Retirement Income Workshop
- Sure-Fire Trading Systems (VectorVest, Inc.)
- Trading as a Business Workshop
- VectorVest 7 EOD
- VectorVest 7 RealTime/IntraDay
- VectorVest AutoTester
- VectorVest Educational Services
- VectorVest OnLine
- VectorVest Options Analyzer
- VectorVest ProGraphics v6.0
- VectorVest ProTrader 7
- VectorVest RealTime Derby Tool
- VectorVest Simulator
- VectorVest Variator
- VectorVest Watchdog
