

HOT TOPICS LIST
- MACD
- Fibonacci
- RSI
- Gann
- ADXR
- Stochastics
- Volume
- Triangles
- Futures
- Cycles
- Volatility
- ZIGZAG
- MESA
- Retracement
- Aroon
INDICATORS LIST
LIST OF TOPICS
PRINT THIS ARTICLE
by Donald W. Pendergast, Jr.
After rising by more than 7,000% in eight years, shares of Priceline.com are now firmly in corrective wave mode.
Position: N/A
Donald W. Pendergast, Jr.
Freelance financial markets writer and online publisher of the Trendzetterz.com S&P 500 Weekly Forecast service.
PRINT THIS ARTICLE
TECHNICAL ANALYSIS
Priceline.com: Corrective Wave Pattern After Massive Rally
07/06/15 03:38:56 PMby Donald W. Pendergast, Jr.
After rising by more than 7,000% in eight years, shares of Priceline.com are now firmly in corrective wave mode.
Position: N/A
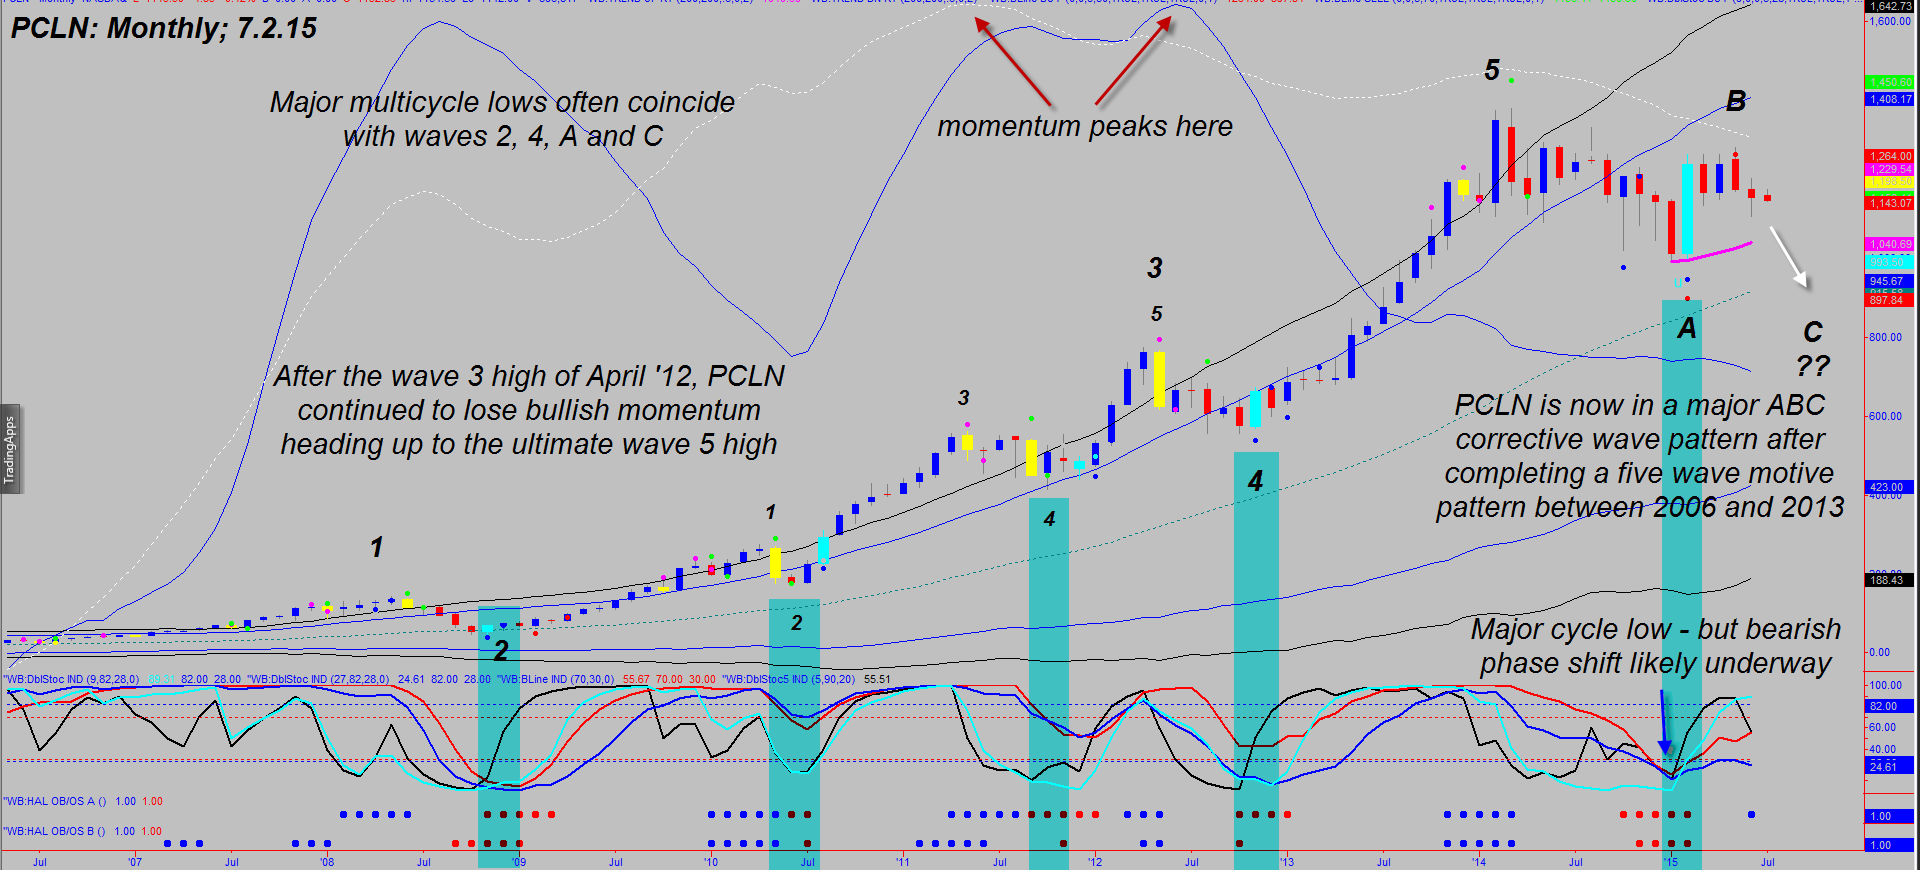
| Elliott wave and price cycle analysis can be used independently of each other — and with profitable results — but whenever a trader can use both in concert, the predictive ability of each analysis technique can be enhanced. Here's a look at these dynamics at work in shares of Priceline.com (PCLN) since 2005. |
|
| Figure 1. Priceline.com (PCLN): Careful, thoughtful analysis of Elliott wave, momentum, cycles, and support & resistance chart dynamics can help lead disciplined traders to profitable outcomes. |
| Graphic provided by: TradeStation. |
| Graphic provided by: ProfitTrader 7 by www.walterbressert.com. |
| |
| The monthly chart of PCLN in Figure 1 plainly shows astute traders and analysts the following valuable information: 1. PCLN has completed a major eight-plus year bullish five wave Elliot motive wave pattern, gaining as much as 7154% during its epic rally from late 2005 to early 2014. 2. Major multicycle lows typically occur in concert with each wave 2, wave 4, wave A, and wave C bottom. This is a strictly visual Elliott wave count on this chart, although specialized EW software can also do a wonderful job of identifying high probability wave counts. This particular EW five-wave motive pattern is a great teaching tool for some other reasons as well: A. As is the case in nearly every wave 5 rally before the ultimate high, price momentum begins to stall out long before the final zenith is reached — note the two momentum lines on the price chart; both were in generally rising mode until mid-2011, with a final confirmed momentum high being achieved in summer 2012. This breakdown of internal momentum began about 32 months prior to PCLN's all-time wave 5 high of 1378.96 in March 2014. This is classic Elliott wave stuff, and is a fantastic way to help fine tune your wave 5 price projections (along with Fibonacci, cycles analysis, support & resistance, and money flow studies). B. The correction of wave 5 has been deeper than any correction seen since the start of the entire run of 2005-2014 and has occurred in the wake of sustained distribution (very pronounced on the weekly chart of PCLN but not shown) by the so-called 'smart money' institutional interests in the market. C. The current chart pattern suggests that the February 2015 low was the end of corrective wave A; this coincided with an otherwise bullish major multicycle low, but after more than four months, PCLN barely made it above its February 2015 high of 1264.00 before pulling back yet again. As things stand now, May 2015 could be the wave B high, with wave C (bearish) now just getting underway. |
|
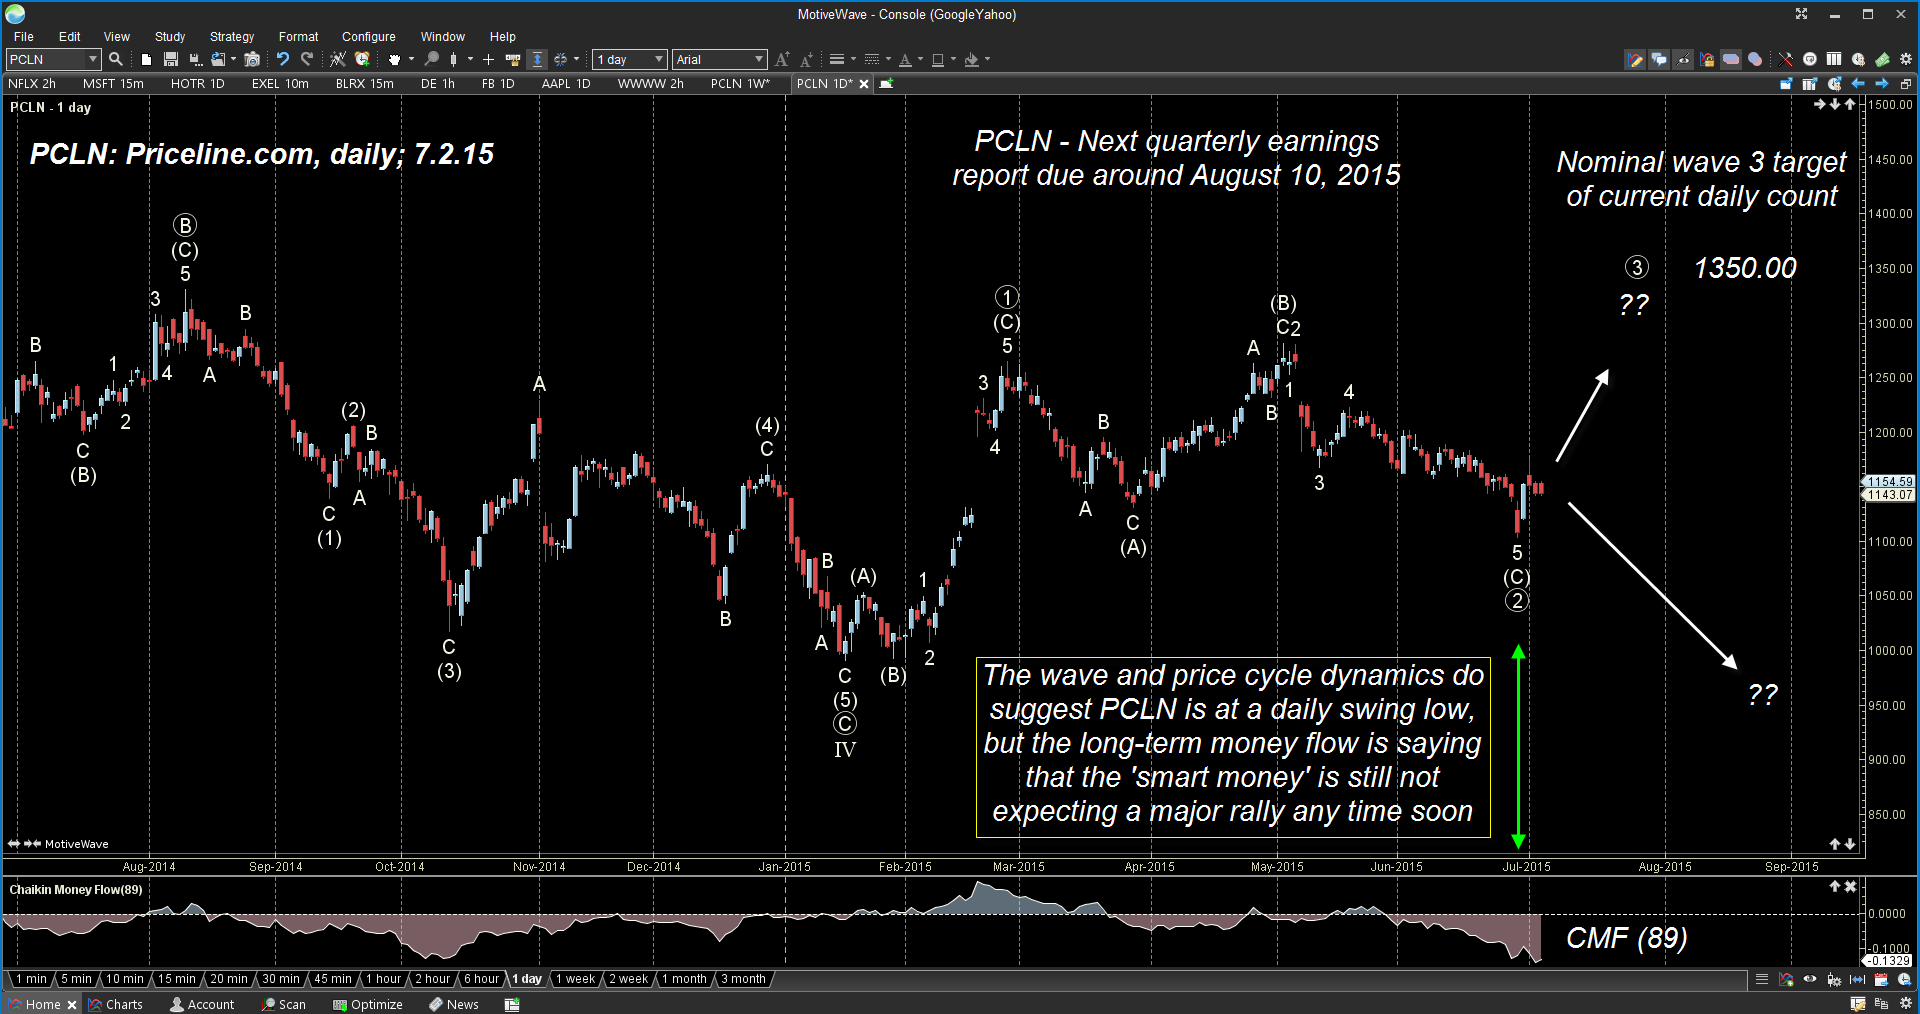
| Figure 2. Daily Chart Of PCLN. Here you see the Elliott wave chart suggesting a possible wave 3 target near 1,350; however, note the ultra-bearish long-term money flow histogram, a clear warning that lower prices may be seen soon. |
| Graphic provided by: MotiveWave Ultimate by www.motivewave.com. |
| |
| The daily chart of PCLN in Figure 2 reveals that a tentative wave 2 low is in place, with a minor rally attempt now underway; the nominal wave 3 target is near 1350.00, but look at how absolutely bearish the 89-day Chaikin money flow histogram (CMF)(89) is at the moment; sustained rallies are highly unlikely with such a bearish money flow histogram reading. This lends more credibility to the idea that a strong wave C on the monthly chart is indeed launching and that substantially lower prices are ahead for PCLN for at least the next few months before the big money folks step back in and begin accumulating once again. Ideally, traders will want to see this histogram provide evidence of a bearish divergence with price along with EW and price cycle low confirmation before they attempt to jump back into PCLN on the long side. Until that happens, speculative bears might find some nice long put profit opportunities as not only PCLN but many other big-name NASDAQ 100/S&P 500 constituents correct further in the summer and fall of 2015. Trade wisely until we meet here again. |
Freelance financial markets writer and online publisher of the Trendzetterz.com S&P 500 Weekly Forecast service.
| Title: | Market consultant and writer |
| Company: | Trendzetterz |
| Address: | 81 Hickory Hollow Drive |
| Crossville, TN 38555 | |
| Phone # for sales: | 904-303-4814 |
| Website: | trendzetterz.com |
| E-mail address: | support@trendzetterz.com |
Traders' Resource Links | |
| Trendzetterz has not added any product or service information to TRADERS' RESOURCE. | |
Click here for more information about our publications!
PRINT THIS ARTICLE

Request Information From Our Sponsors
- StockCharts.com, Inc.
- Candle Patterns
- Candlestick Charting Explained
- Intermarket Technical Analysis
- John Murphy on Chart Analysis
- John Murphy's Chart Pattern Recognition
- John Murphy's Market Message
- MurphyExplainsMarketAnalysis-Intermarket Analysis
- MurphyExplainsMarketAnalysis-Visual Analysis
- StockCharts.com
- Technical Analysis of the Financial Markets
- The Visual Investor
- VectorVest, Inc.
- Executive Premier Workshop
- One-Day Options Course
- OptionsPro
- Retirement Income Workshop
- Sure-Fire Trading Systems (VectorVest, Inc.)
- Trading as a Business Workshop
- VectorVest 7 EOD
- VectorVest 7 RealTime/IntraDay
- VectorVest AutoTester
- VectorVest Educational Services
- VectorVest OnLine
- VectorVest Options Analyzer
- VectorVest ProGraphics v6.0
- VectorVest ProTrader 7
- VectorVest RealTime Derby Tool
- VectorVest Simulator
- VectorVest Variator
- VectorVest Watchdog