HOT TOPICS LIST
- MACD
- Fibonacci
- RSI
- Gann
- ADXR
- Stochastics
- Volume
- Triangles
- Futures
- Cycles
- Volatility
- ZIGZAG
- MESA
- Retracement
- Aroon
INDICATORS LIST
LIST OF TOPICS
PRINT THIS ARTICLE
by Koos van der Merwe
With the world markets focussed on the problems in Greece, looking for a stock to trade can be a challenge.
Position: Sell
Koos van der Merwe
Has been a technical analyst since 1969, and has worked as a futures and options trader with First Financial Futures in Johannesburg, South Africa.
PRINT THIS ARTICLE
TECHNICAL ANALYSIS
A Look At Qualcomm
06/30/15 04:48:08 PMby Koos van der Merwe
With the world markets focussed on the problems in Greece, looking for a stock to trade can be a challenge.
Position: Sell
| The problems in Greece, whether you accept them or not, is influencing the stock market. However, the maxim, 'when the market is falling, look for buy opportunities,' always comes to mind, and with July around the corner, a month that stocks usually recover from the 'Sell in May' maxim, finding what stocks to buy is simply a matter of looking for those stocks that have fallen hard, and studying the charts. Of course there are shares that have collapsed and will continue to collapse, and identifying them can be a challenge, but there are also those companies that have a sound management, and have fallen simply because investors have taken profits. Never forget, 'a bird in the hand is worth two in the bush.' Qualcomm Corp. (QCOM) is one stock worth keeping an eye on. |

|
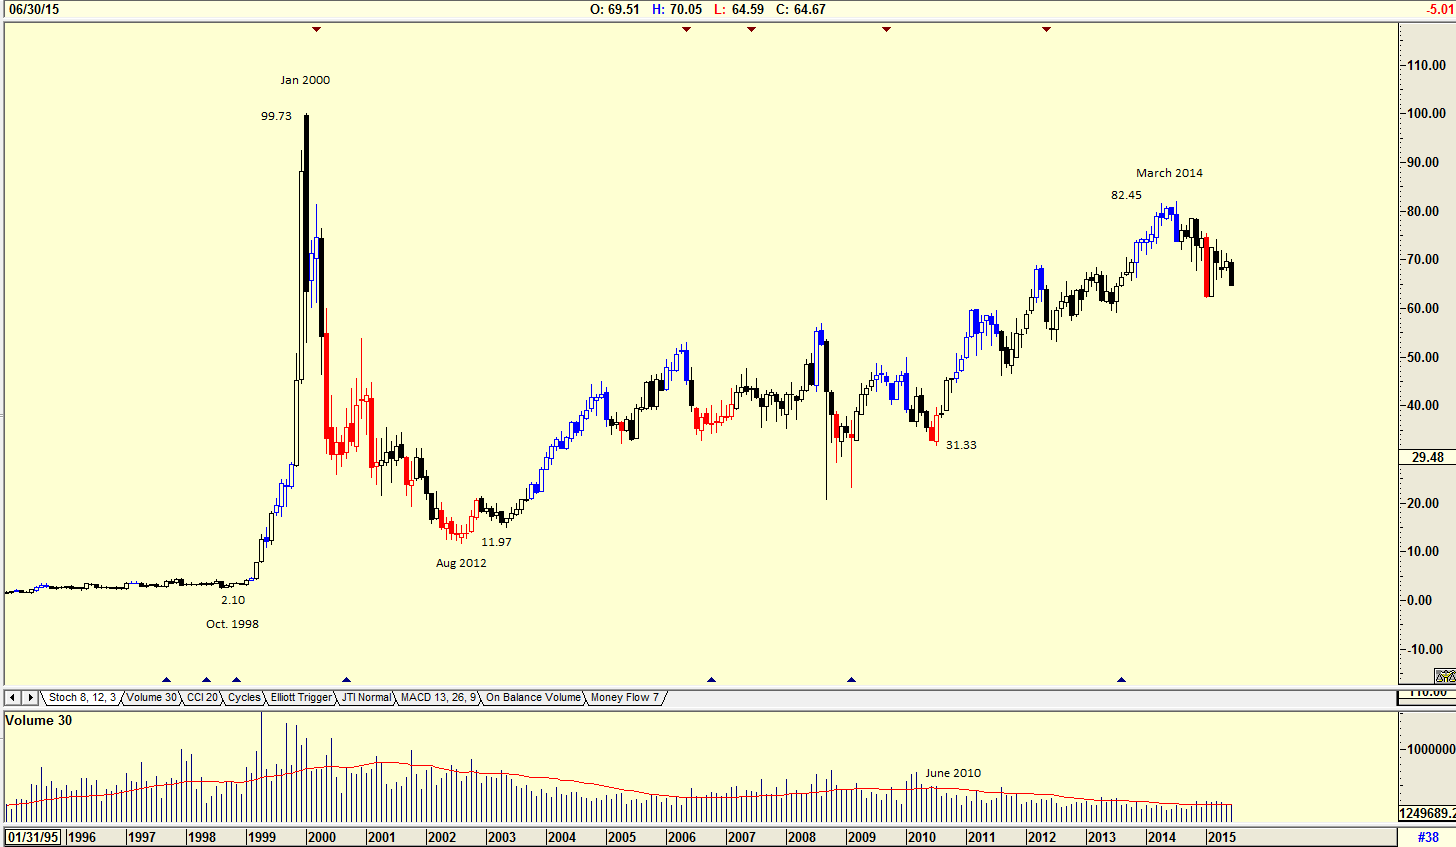
| Figure 1. Monthly Chart Of Qualcomm Corp. (QCOM). Since its low in August 2012, QCOM has risen to reach a high of $82.45 by March 2014. Volume is below average which suggests that the stock is being purchased by investors for the long-term hold. |
| Graphic provided by: AdvancedGET. |
| |
| The chart in Figure 1 is a monthly chart of QCOM showing how the stock price rose from $2.10 in October 1998 to a high of $99.73 by January 2000 and then collapsed when the technology bubble burst to a low of $11.97 by August 2012. From that low, the stock price rose slowly to reach a high of $82.45 by March 2014. The share price as of the end of June 2015 was $64.67. Volume has been below average since June 2010 when the stock price was $31.33. With the rise to $82.45 on below average volume, the impression received is that the stock is being purchased by investors for the long-term hold, and is not traded in the short-term. |

|
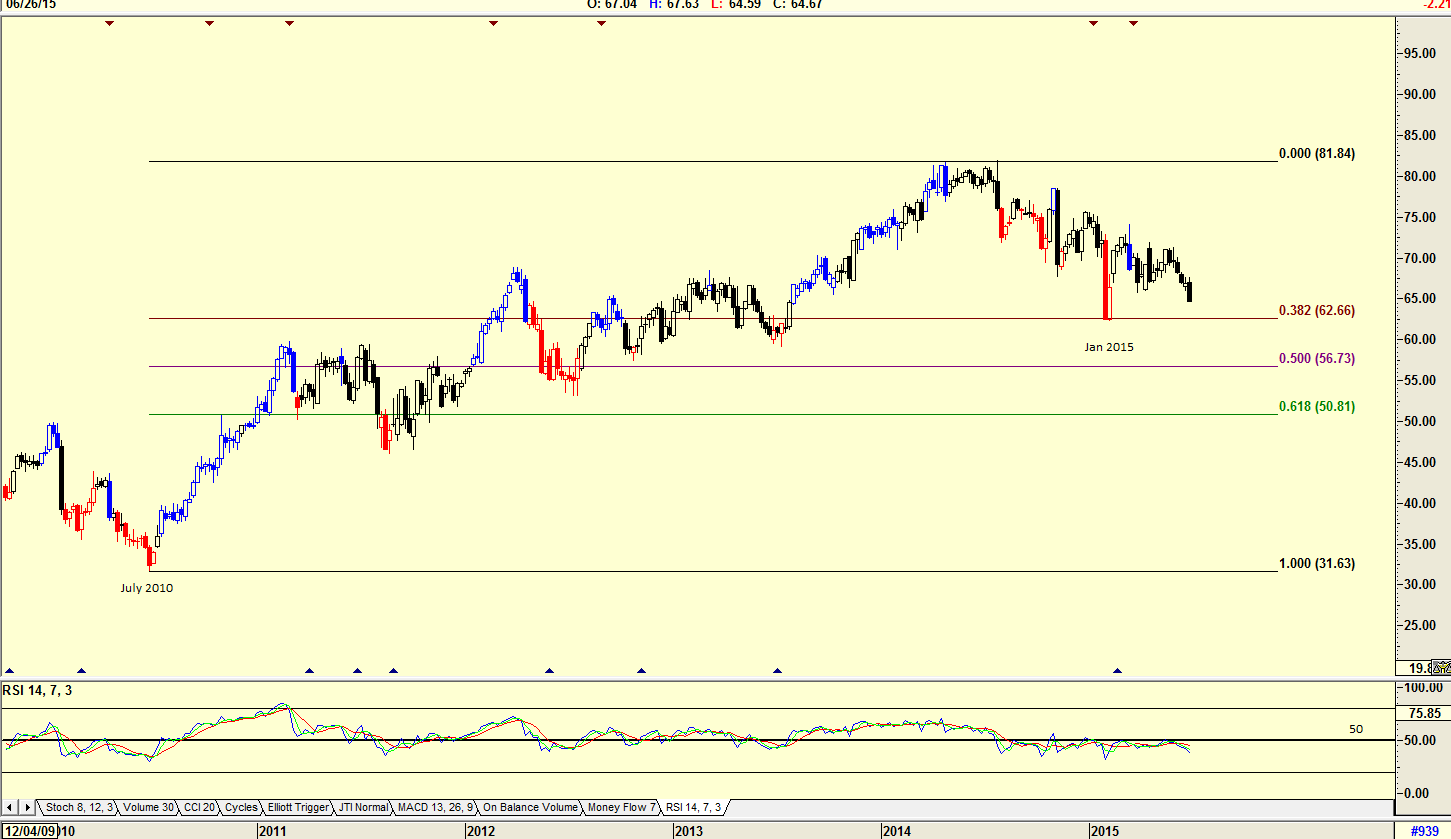
| Figure 2. Weekly Chart Of QCOM. The stock price fell to $62.66, the 38.2% retracement level. This could well be a support level for the stock price. |
| Graphic provided by: AdvancedGET. |
| |
| The weekly chart in Figure 2 shows how the price rose from a low of $31.63 in July 2010 to a high of $81.84 by March 2014. From that high the share price has fallen to $62.66, the 38.2% retracement. This level could well be a support level for the stock price, and you should keep an eye on it. Note the relative strength index (RSI) which has been moving sideways at the 50 horizontal level. In the past it has suggested a buy signal by breaking below and then above this level. |

|
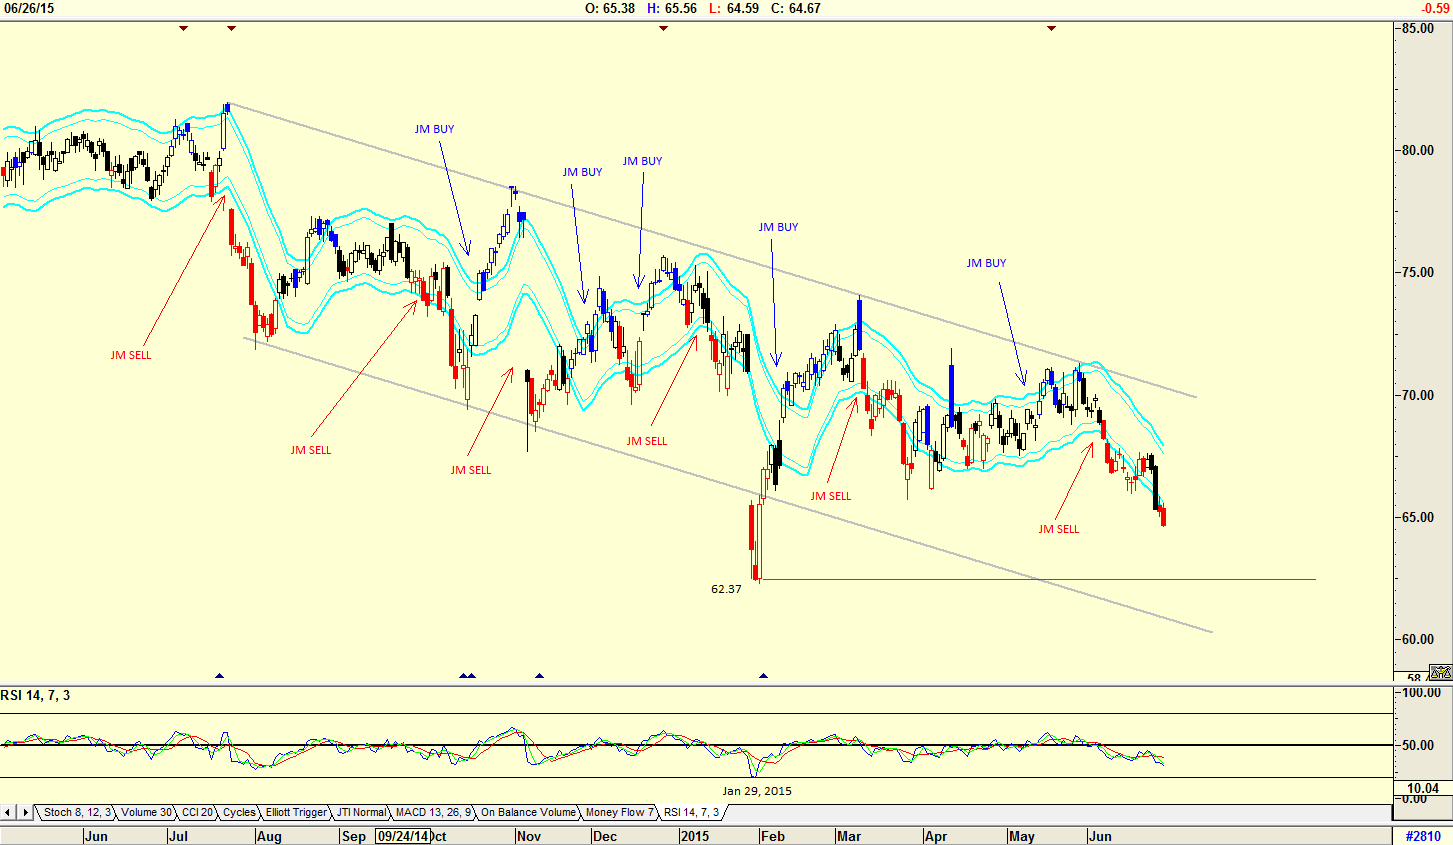
| Figure 3. Daily Chart With JM Internal Band. The chart shows that at the moment, the stock price is in sell mode. The RSI has been moving along the 50-period horizontal line. |
| Graphic provided by: AdvancedGET. |
| |
| The chart in Figure 3 is a daily chart with a JM internal band. The JM internal Band is a 15-period simple moving average offset 2% positive and 2% negative. A move above the upper band suggests a buy signal, and below the lower band a sell signal, as shown on the chart. The chart is presently showing the share price in sell mode. Note the RSI gave a buy on January 29, 2015. Since then it has been tracing the 50-period horizontal line. I would not be a buyer of Qualcomm at the moment, however the stock is on my watch list and I shall only be a buyer should it move above the upper JM internal band line. |
Has been a technical analyst since 1969, and has worked as a futures and options trader with First Financial Futures in Johannesburg, South Africa.
| Address: | 3256 West 24th Ave |
| Vancouver, BC | |
| Phone # for sales: | 6042634214 |
| E-mail address: | petroosp@gmail.com |
Click here for more information about our publications!
PRINT THIS ARTICLE

Request Information From Our Sponsors
- StockCharts.com, Inc.
- Candle Patterns
- Candlestick Charting Explained
- Intermarket Technical Analysis
- John Murphy on Chart Analysis
- John Murphy's Chart Pattern Recognition
- John Murphy's Market Message
- MurphyExplainsMarketAnalysis-Intermarket Analysis
- MurphyExplainsMarketAnalysis-Visual Analysis
- StockCharts.com
- Technical Analysis of the Financial Markets
- The Visual Investor
- VectorVest, Inc.
- Executive Premier Workshop
- One-Day Options Course
- OptionsPro
- Retirement Income Workshop
- Sure-Fire Trading Systems (VectorVest, Inc.)
- Trading as a Business Workshop
- VectorVest 7 EOD
- VectorVest 7 RealTime/IntraDay
- VectorVest AutoTester
- VectorVest Educational Services
- VectorVest OnLine
- VectorVest Options Analyzer
- VectorVest ProGraphics v6.0
- VectorVest ProTrader 7
- VectorVest RealTime Derby Tool
- VectorVest Simulator
- VectorVest Variator
- VectorVest Watchdog
