

HOT TOPICS LIST
- MACD
- Fibonacci
- RSI
- Gann
- ADXR
- Stochastics
- Volume
- Triangles
- Futures
- Cycles
- Volatility
- ZIGZAG
- MESA
- Retracement
- Aroon
INDICATORS LIST
LIST OF TOPICS
PRINT THIS ARTICLE
by Donald W. Pendergast, Jr.
Apple Inc.'s (AAPL) stunning 12-year old bull run may finally be reaching its exhaustion stage; as this stock is often considered a bellwether for the US economy as a whole, major moves up or down in this mega-cap issue's share price can affect the lives of millions of investors and thousands of businesses.
Position: N/A
Donald W. Pendergast, Jr.
Freelance financial markets writer and online publisher of the Trendzetterz.com S&P 500 Weekly Forecast service.
PRINT THIS ARTICLE
CYCLES
AAPL: Monthly Five Wave Elliott Pattern
06/30/15 12:06:51 PMby Donald W. Pendergast, Jr.
Apple Inc.'s (AAPL) stunning 12-year old bull run may finally be reaching its exhaustion stage; as this stock is often considered a bellwether for the US economy as a whole, major moves up or down in this mega-cap issue's share price can affect the lives of millions of investors and thousands of businesses.
Position: N/A
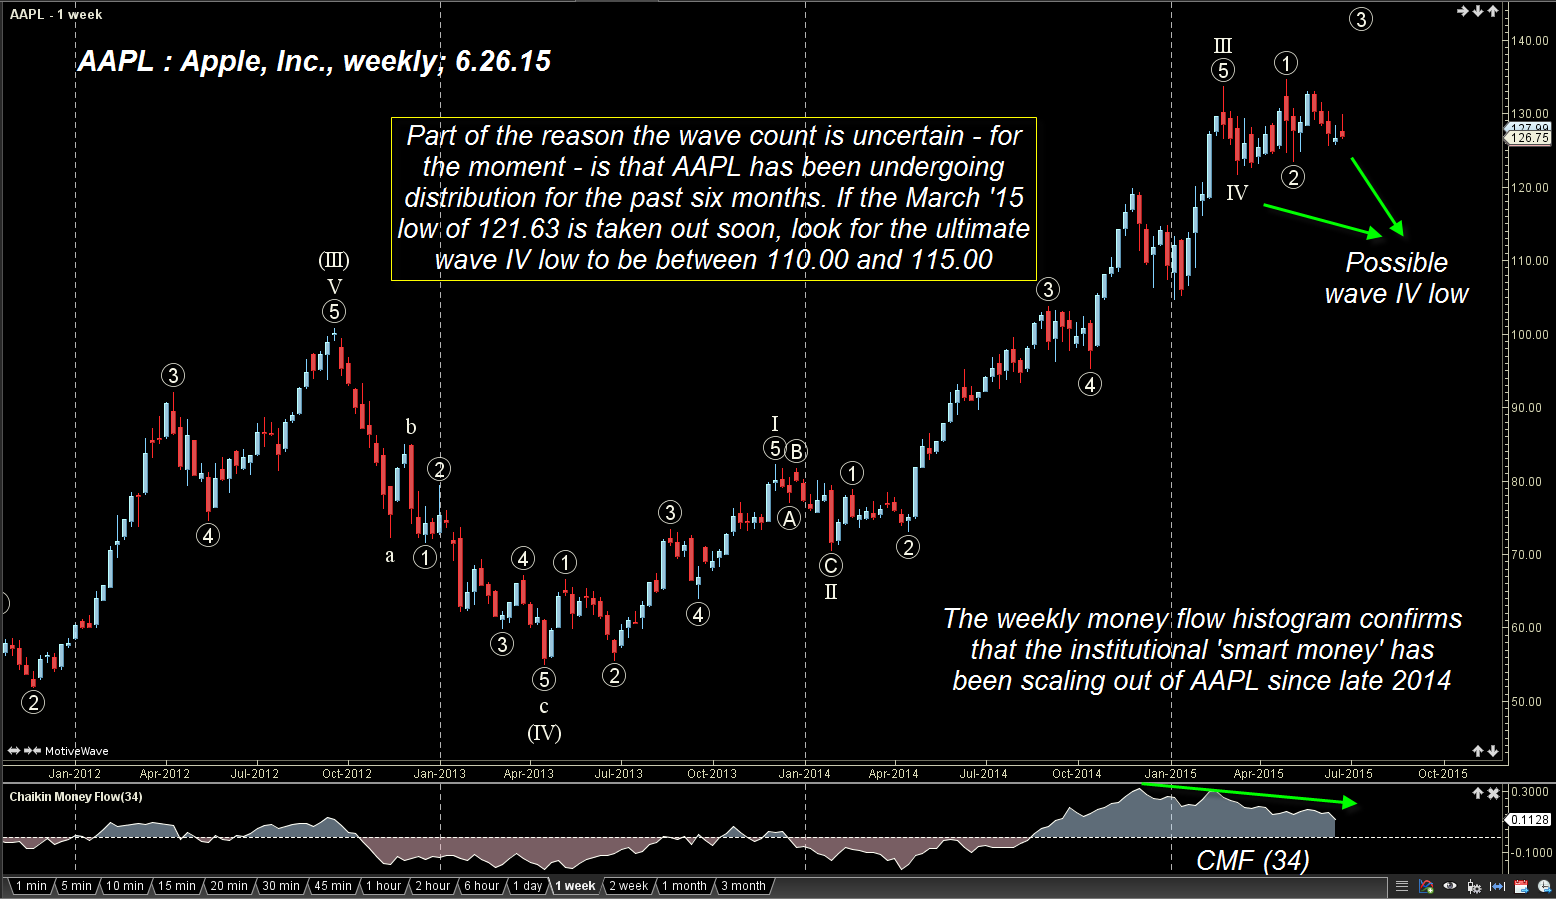
| With a major five-wave Elliott pattern at or near completion of Apple's monthly chart, now is a good time to take a long hard look at this stock and any others you may have been holding onto for a long time. |
|
| Figure 1. Weekly Chart Of Apple, Inc. (AAPL). This stock has been under distribution since late 2014 so don't be surprised to see the ultimate wave 4 low come somewhere between $110.00 and 115.00. |
| Graphic provided by: TradeStation. |
| Graphic provided by: MotiveWave Ultimate by www.motivewave.com. |
| |
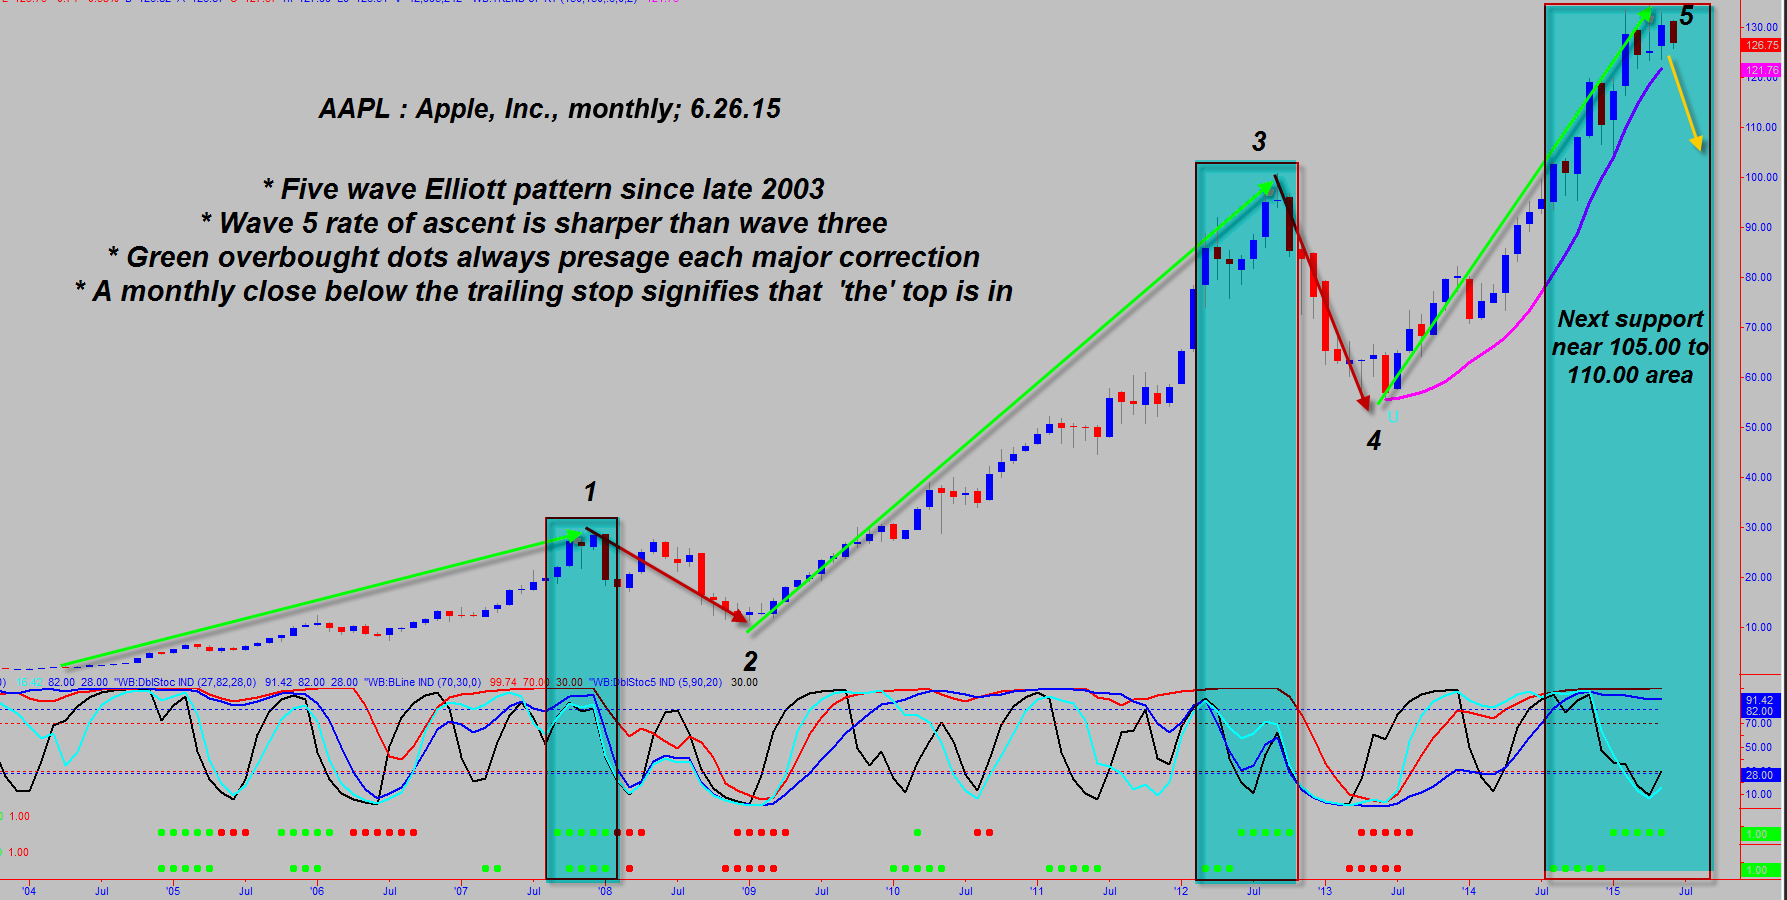
| Adjusted for splits and dividends, AAPL was trading at $0.91 per share in late 2003; it subsequently rose to more than $134.00 per share by April 2015, a gain of better than 14,000 percent! Hopefully, you took some gains up at those lofty levels, because the three charts you're about to see suggest that the wave 5 high for the monthly chart of AAPL is already in place and that a proportional correction and/or bearish trend reversal of the entire 2003-2015 rally has already begun: Beginning with the weekly chart in Figure 1, note that the wave 5 of III is already in place and that a tentative wave 5 has plotted; AAPL has been under steady distribution since late 2014, and this looks like a stock that will break lower and put in a wave 4 low somewhere between 110.00 and 115.00 before any chance of a sustainable, institutional-led rally can commence. The low of this distribution pattern is 121.63, made in March of this year (2015), FYI. The chart in Figure 2 is a monthly for AAPL and it shows that the stock is in the same predicament it was in at the 2007 and 2012 highs; note that then as now both sets of the green overbought dots are warning that AAPL is statistically overextended and that a major cycle high is imminent if not already in place. This monthly chart clearly reveals a complete bullish five-wave Elliott motive wave pattern, one that is likely now complete. The trailing stop that is tracking wave 5 is specially-designed to track the dominant price cycle in the next higher time frame; a monthly close beneath 121.78 will mean that this five wave advance is one for the record books. |
|
| Figure 2. Overbought? Here you see that two sets of statistically derived overbought indicators (green dots). These always presage a major decline in this stock. |
| Graphic provided by: TradeStation. |
| Graphic provided by: ProfitTrader 7 by www.walterbressert.com. |
| |
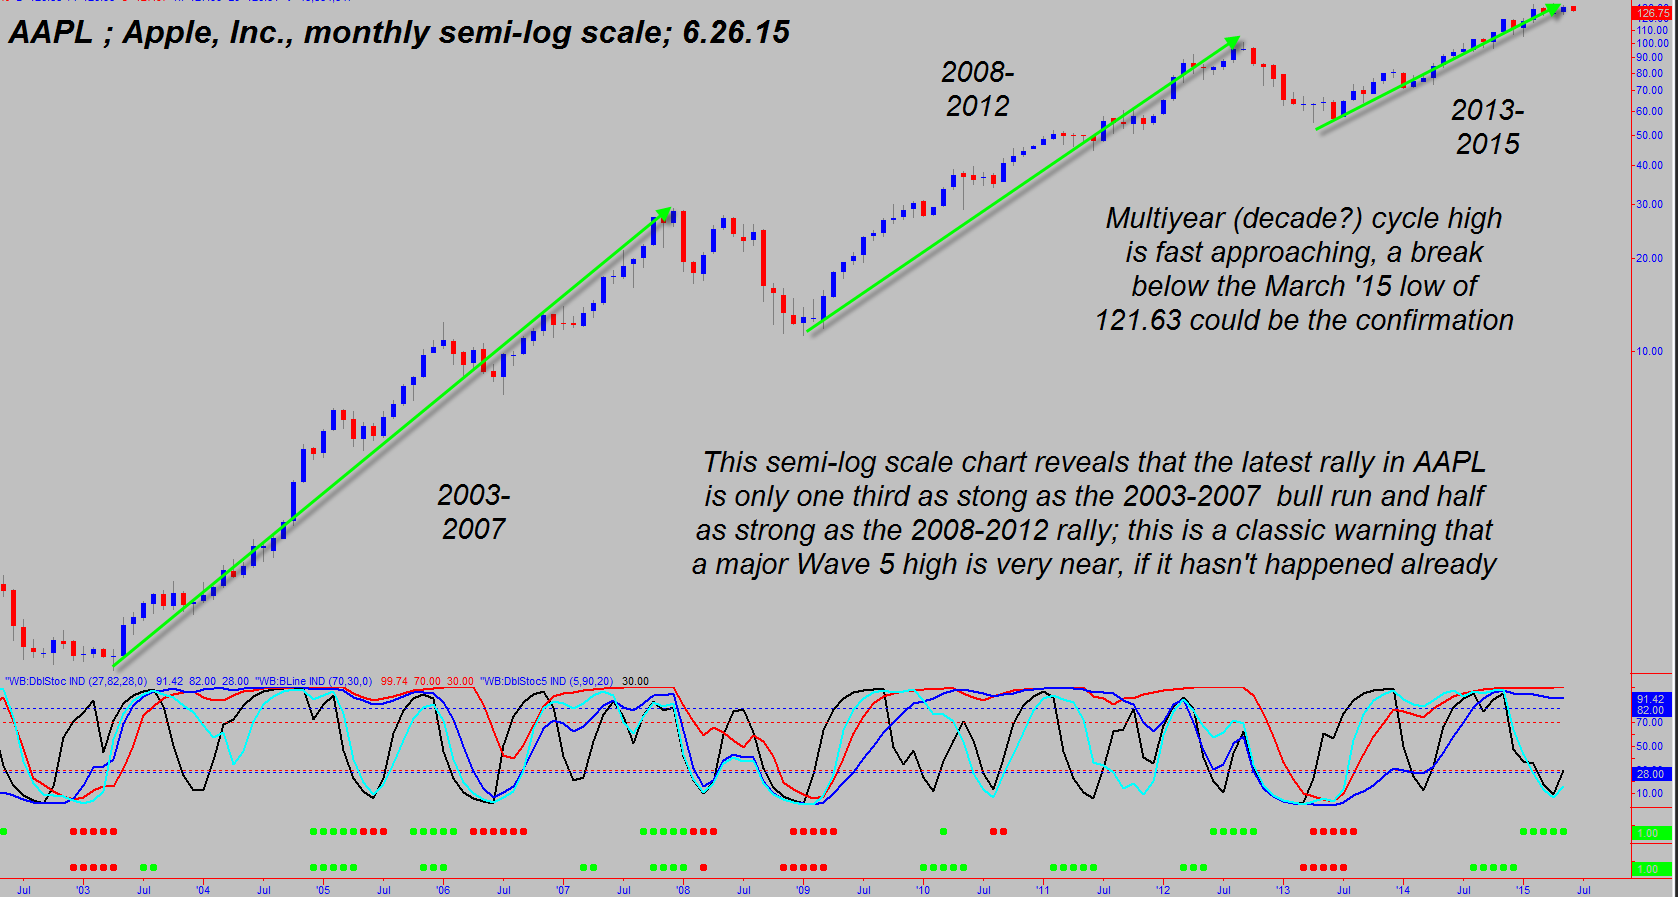
| Finally, an unusual look at the same five-wave advance, this time using a semi-log scaled chart (Figure 3); here we find that each successive rally gains less in percentage terms than its predecessor and that this final and fifth wave is the least robust of the three bullish impulse waves witnessed since late 2003 in AAPL. If you've read the Robert Prechter/A.J. Frost classic "Elliott Wave Principle" you may remember where Prechter writes that fifth wave advances in stocks are driven primarily by speculation rather than by strong, sustainable economic growth trends in the broad economy. This may also explain why it's the "smart money" institutional investors who are always selling heavily into the final stages of every fifth wave advance — to greedy, ignorant speculators who really don't have a clue as to the true nature of how/why the stock market works the way it does. Whether or not the typical long-term AAPL investor who joined this fifth wave party can be considered ignorant is a moot point, but it remains that by many measures, AAPL is at or near a multiyear (multidecade?) cycle high of great magnitude. Watch the March 2015 low of 121.63 carefully; if this breaks with heavy selling volume, expect AAPL to run down toward 110.00 to 115.00 at a rapid clip as the A-wave of a large ABC corrective pattern begins to unfold. Trade wisely until we meet here again. |
|
| Figure 3. Semi-log Monthly Chart. Here you see that AAPL reveals steadily declining momentum, especially in the latest advance which began in early 2013. |
| Graphic provided by: TradeStation. |
| Graphic provided by: ProfitTrader 7 by www.walterbressert.com. |
| |
Freelance financial markets writer and online publisher of the Trendzetterz.com S&P 500 Weekly Forecast service.
| Title: | Market consultant and writer |
| Company: | Trendzetterz |
| Address: | 81 Hickory Hollow Drive |
| Crossville, TN 38555 | |
| Phone # for sales: | 904-303-4814 |
| Website: | trendzetterz.com |
| E-mail address: | support@trendzetterz.com |
Traders' Resource Links | |
| Trendzetterz has not added any product or service information to TRADERS' RESOURCE. | |
Click here for more information about our publications!
Comments
Date:�07/09/15Rank:�4Comment:�

Request Information From Our Sponsors
- VectorVest, Inc.
- Executive Premier Workshop
- One-Day Options Course
- OptionsPro
- Retirement Income Workshop
- Sure-Fire Trading Systems (VectorVest, Inc.)
- Trading as a Business Workshop
- VectorVest 7 EOD
- VectorVest 7 RealTime/IntraDay
- VectorVest AutoTester
- VectorVest Educational Services
- VectorVest OnLine
- VectorVest Options Analyzer
- VectorVest ProGraphics v6.0
- VectorVest ProTrader 7
- VectorVest RealTime Derby Tool
- VectorVest Simulator
- VectorVest Variator
- VectorVest Watchdog
- StockCharts.com, Inc.
- Candle Patterns
- Candlestick Charting Explained
- Intermarket Technical Analysis
- John Murphy on Chart Analysis
- John Murphy's Chart Pattern Recognition
- John Murphy's Market Message
- MurphyExplainsMarketAnalysis-Intermarket Analysis
- MurphyExplainsMarketAnalysis-Visual Analysis
- StockCharts.com
- Technical Analysis of the Financial Markets
- The Visual Investor