

HOT TOPICS LIST
- MACD
- Fibonacci
- RSI
- Gann
- ADXR
- Stochastics
- Volume
- Triangles
- Futures
- Cycles
- Volatility
- ZIGZAG
- MESA
- Retracement
- Aroon
INDICATORS LIST
LIST OF TOPICS
PRINT THIS ARTICLE
by Donald W. Pendergast, Jr.
Amazon.com stages a weekly chart breakout after an eight-week consolidation.
Position: N/A
Donald W. Pendergast, Jr.
Freelance financial markets writer and online publisher of the Trendzetterz.com S&P 500 Weekly Forecast service.
PRINT THIS ARTICLE
CYCLES
Amazon.com: Bullish Breakout Setup
06/24/15 03:46:00 PMby Donald W. Pendergast, Jr.
Amazon.com stages a weekly chart breakout after an eight-week consolidation.
Position: N/A
| It's rare to see an outstanding bullish technical setup on both the daily and weekly time frame — and with a different set of technical dynamics on the daily and the weekly. Here's a fascinating look at a high-probability bullish breakout in shares of Amazon.com (AMZN). |
|
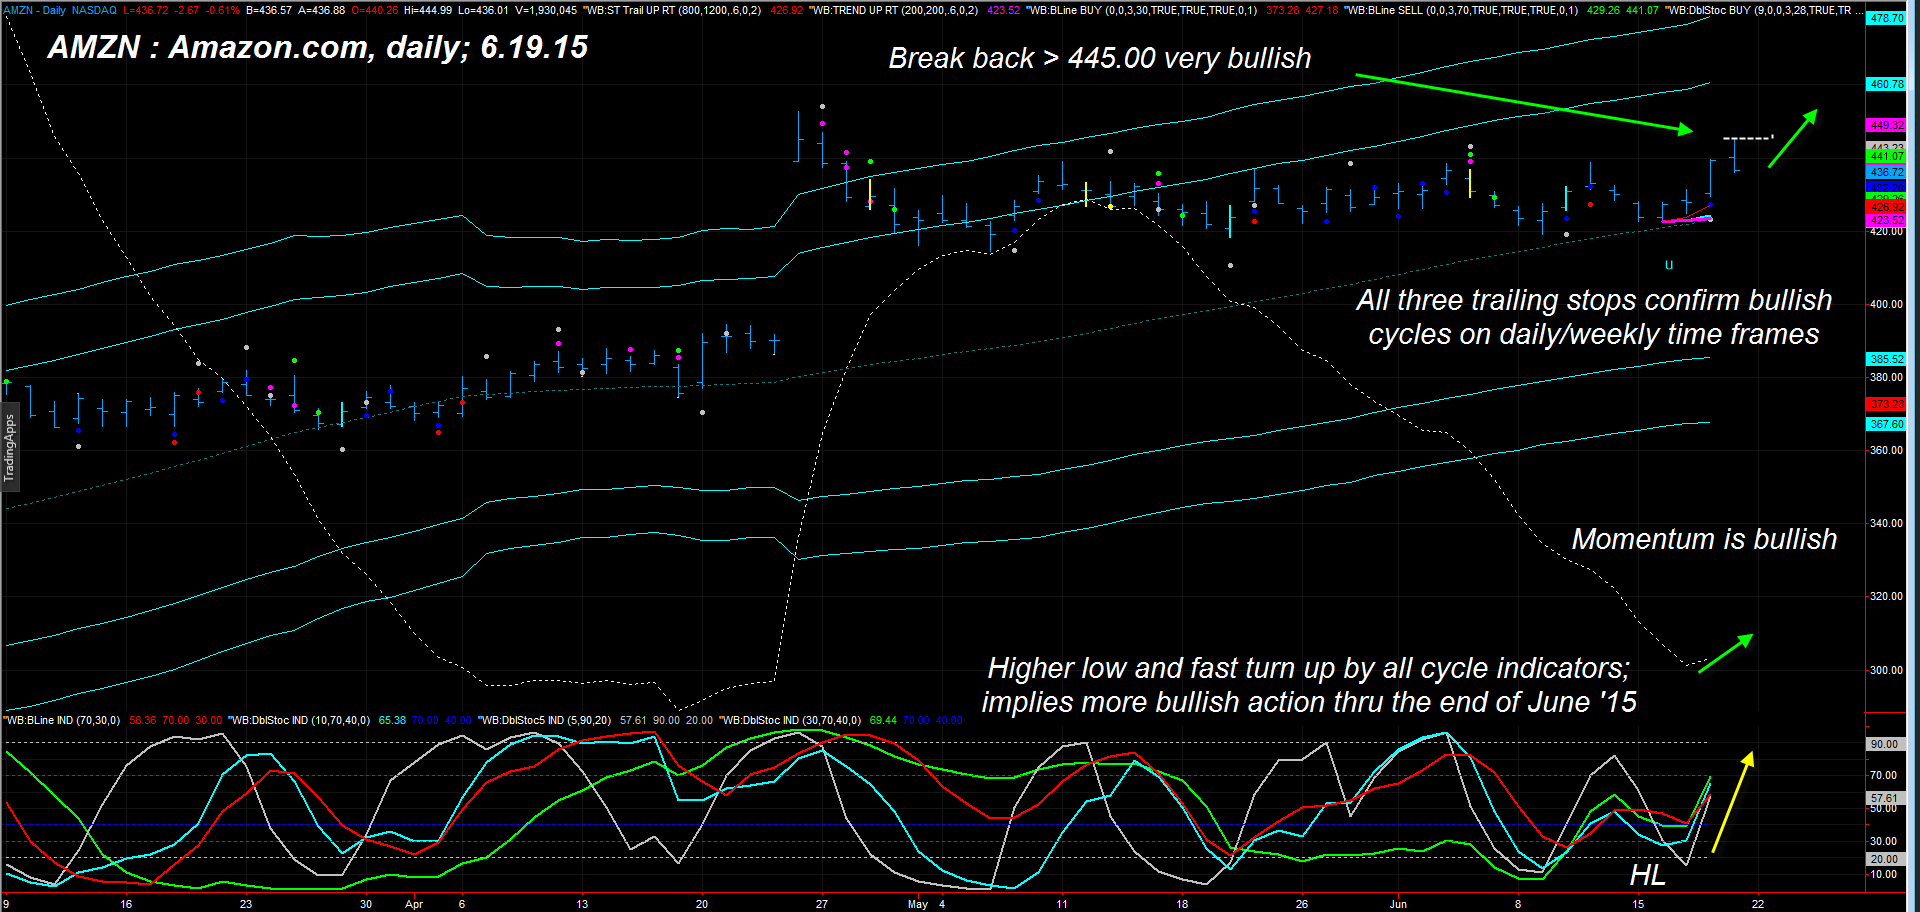
| Figure 1. Daily Chart Of Amazon.com (AMZN). AMZN has a bullish cycle oscillator pattern that suggests the potential for more upside in the days ahead. |
| Graphic provided by: TradeStation. |
| Graphic provided by: ProfitTrader 7 by www.walterbressert.com. |
| |
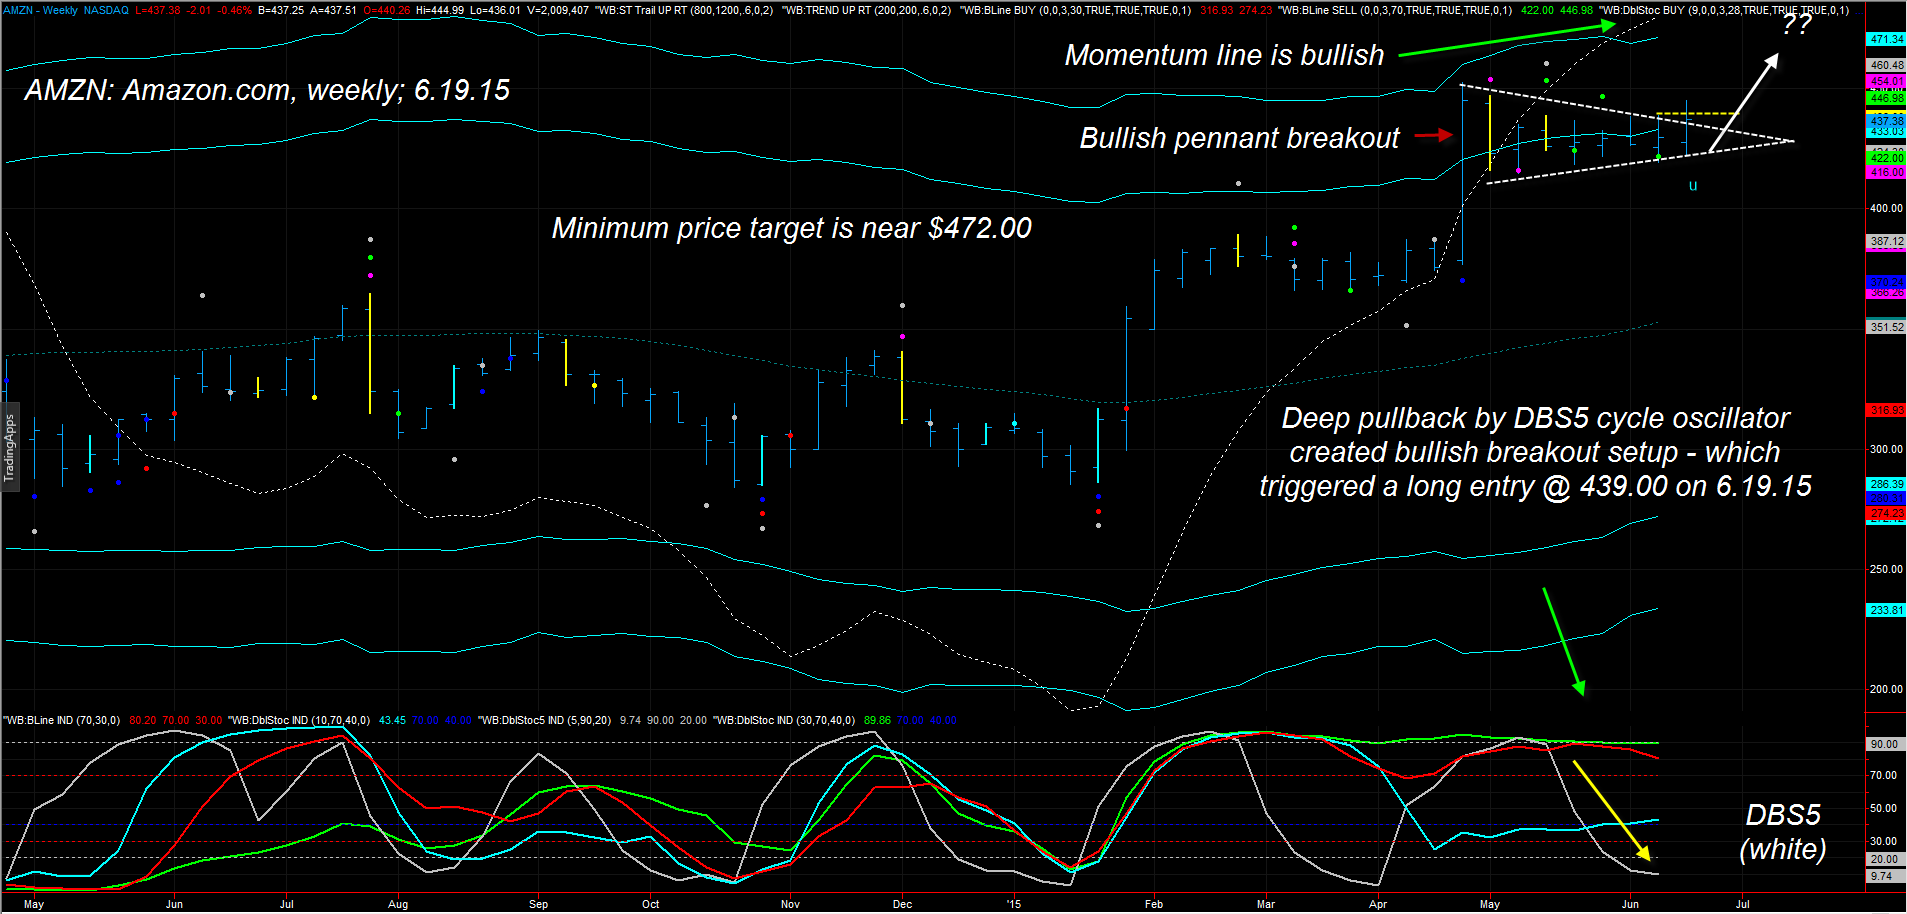
| After AMZN staged a powerful bullish breakout on April 24, 2015, the profit-takers emerged in force and the stock went into an eight-week long consolidation pattern that ended up in the shape of a pennant (most easily seen on its weekly chart). Now, this happens to many stocks over the course of a year or two, but what make this nascent bullish breakout in AMZN unique is how the daily and weekly technicals are in perfect harmony as the stock may be poised to run back up to $472 or even higher: On AMZN's daily chart in Figure 1, we find these bullish dynamics: 1. The four primary cycle oscillators formed a higher low pattern and have now begun to turn sharply higher as a group. This is a classic cycles trading setup that can sometimes lead to a one to two week rally until the next cycle high. 2. The daily momentum line is bullish. 3. All three trailing stops are confirming that the daily/weekly cycles are in bullish agreement. On AMZN's weekly chart in Figure 2, we find these bullish dynamics: 1. The breakout from a two-month old consolidation pattern (pennant). 2. The momentum line is in bullish mode. 3. The shorter DBS5 cycle oscillator (white) pulled sharply lower even as the red and green (long term) cycle oscillators remain near their upper limits; then AMZN rallied back above the high of the weekly price bar that coincided with the low of the deep DBS5 oscillator pullback, triggering a powerful weekly buy signal at $439.00 on Friday morning June 19, 2015. Typically, a stock will rally into the next half-cycle high (weekly cycle in AMZN is 22 weeks, half cycle is 11 weeks); essentially this means that AMZN stands a good chance of rallying for at least the next three to five weeks until the mid-cycle high is reached. 4. Even more potentially bullish is the weekly flag (pennant) formation price target, which is near $485.00 to $490.00. 5. AMZN's long-term fundamentals are also attractive; it's interesting to see how they have evolved from basically an online book seller to one of the world's largest and most successful retail outlets over the past 16 years; with their new Kindles and Amazon TV offerings continuing to attract new customers, look for this stock to continue to attract big institutional inflows for some time to come. |
|
| Figure 2. Weekly Chart Of AMZN. The pennant formation suggests that this stock may have an upside target of $485.00 to $490.00. Note the sharp pullback by the short-term cycle oscillator, followed by a fresh breakout. |
| Graphic provided by: TradeStation. |
| Graphic provided by: ProfitTrader 7 by www.walterbressert.com. |
| |
| At the moment, the simplest and most conservative way to play this emerging breakout in AMZ is to put on a covered call trade, using near-term calls. Look to sell slightly in-the-money calls (ITM) if/when AMZN breaks back above 445.00 for every 100 shares you simultaneously acquire in AMZN. Consider running a 13-18 day exponential moving average (EMA) as your trade management trailing stop until either the stock is called away from you or you get a daily close by the stock below the EMA. Risk no more than 1-2% of your account equity on this trade, no matter how splendid these chart patterns may look. Trade wisely until we meet here again. |
Freelance financial markets writer and online publisher of the Trendzetterz.com S&P 500 Weekly Forecast service.
| Title: | Market consultant and writer |
| Company: | Trendzetterz |
| Address: | 81 Hickory Hollow Drive |
| Crossville, TN 38555 | |
| Phone # for sales: | 904-303-4814 |
| Website: | trendzetterz.com |
| E-mail address: | support@trendzetterz.com |
Traders' Resource Links | |
| Trendzetterz has not added any product or service information to TRADERS' RESOURCE. | |
Click here for more information about our publications!
Comments
Date:�06/28/15Rank:�Comment:�I HATE ABSOLUTELY HATE BLACK BACKGROUND CHARTS.
I CANNOT - GOT IT -- CANNOT SEE THE CHART PATTERN.

Request Information From Our Sponsors
- StockCharts.com, Inc.
- Candle Patterns
- Candlestick Charting Explained
- Intermarket Technical Analysis
- John Murphy on Chart Analysis
- John Murphy's Chart Pattern Recognition
- John Murphy's Market Message
- MurphyExplainsMarketAnalysis-Intermarket Analysis
- MurphyExplainsMarketAnalysis-Visual Analysis
- StockCharts.com
- Technical Analysis of the Financial Markets
- The Visual Investor
- VectorVest, Inc.
- Executive Premier Workshop
- One-Day Options Course
- OptionsPro
- Retirement Income Workshop
- Sure-Fire Trading Systems (VectorVest, Inc.)
- Trading as a Business Workshop
- VectorVest 7 EOD
- VectorVest 7 RealTime/IntraDay
- VectorVest AutoTester
- VectorVest Educational Services
- VectorVest OnLine
- VectorVest Options Analyzer
- VectorVest ProGraphics v6.0
- VectorVest ProTrader 7
- VectorVest RealTime Derby Tool
- VectorVest Simulator
- VectorVest Variator
- VectorVest Watchdog