HOT TOPICS LIST
- MACD
- Fibonacci
- RSI
- Gann
- ADXR
- Stochastics
- Volume
- Triangles
- Futures
- Cycles
- Volatility
- ZIGZAG
- MESA
- Retracement
- Aroon
INDICATORS LIST
LIST OF TOPICS
PRINT THIS ARTICLE
by Koos van der Merwe
Should you buy & sell a stock just because the relative strength index says so?
Position: Accumulate
Koos van der Merwe
Has been a technical analyst since 1969, and has worked as a futures and options trader with First Financial Futures in Johannesburg, South Africa.
PRINT THIS ARTICLE
TECHNICAL INDICATORS
Looking For A Stop Loss Indicator
06/24/15 03:37:24 PMby Koos van der Merwe
Should you buy & sell a stock just because the relative strength index says so?
Position: Accumulate
| We all know the story about Welles Wilder and the relative strength index (RSI). J. Welles Wilder Jr. is well known for his contributions to technical analysis. He is the father of several technical indicators that are now considered to be core indicators in technical analysis software; his most famous being the RSI. In today's computerized world, where more and more computers are trading based on designed algorithms, does the RSI still function as designed? I would say, "yes." Here are some examples of the accuracy and success of the RSI. |

|
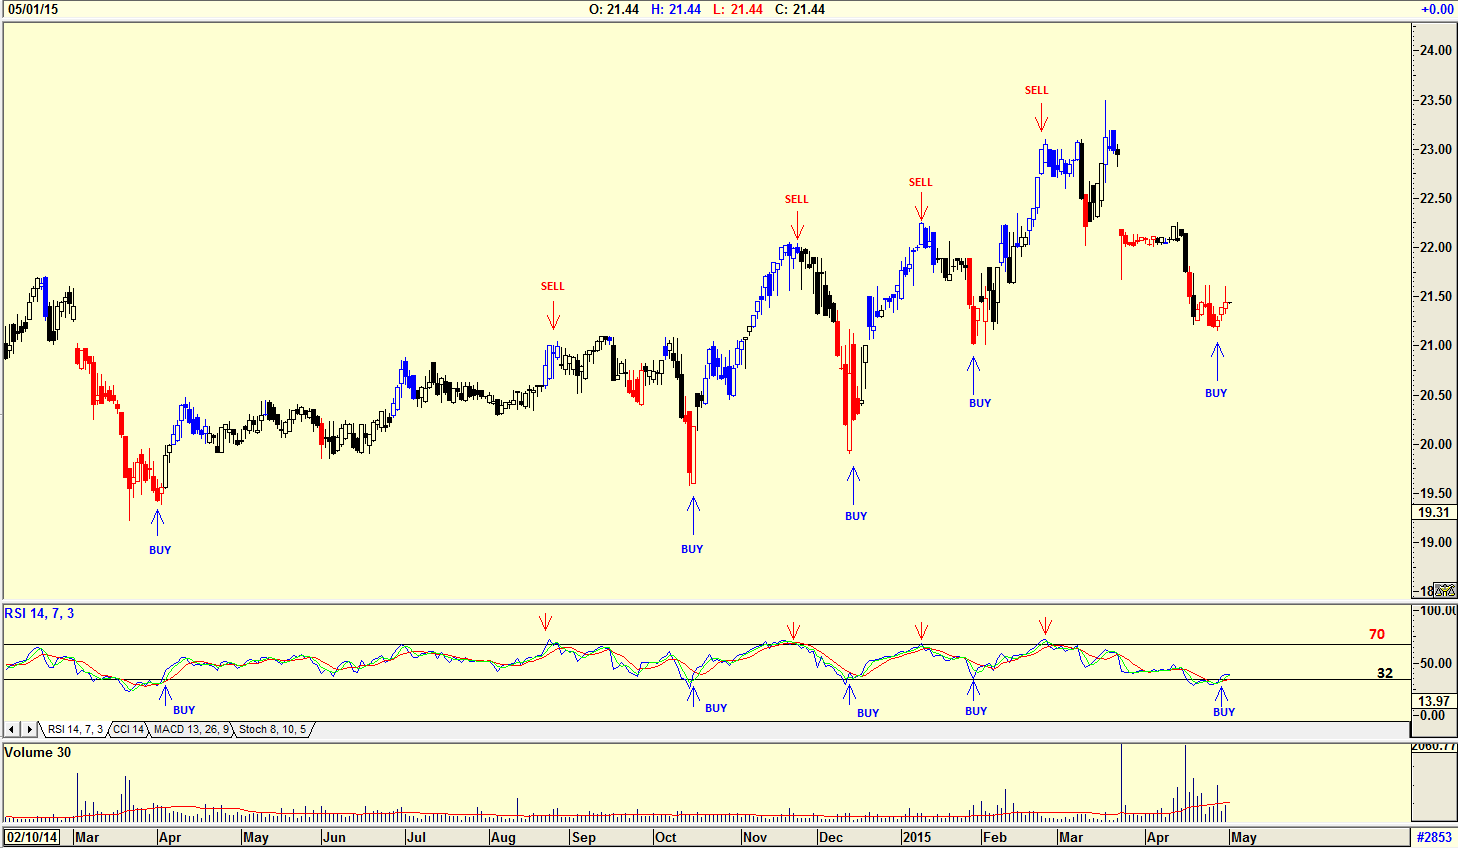
| Figure 1. RSI Buys & Sells. Here you see the chart of Boston Pizza Royalties Income Fund. Notice how the share price reacted to the 14-period RSI. |
| Graphic provided by: AdvancedGET. |
| |
| In Figure 1 you see the chart of Boston Pizza Royalties Income Fund that is listed on the Toronto Stock Exchange. Notice how the share price reacted to the 14-period RSI, as designed by Welles Wilder. A buy signal is given when the indicator moves below the 32 horizontal line and then moves above it, and a sell signal is given when the price moves above the 70 horizontal line, and then moves below it. Buy signals can be accurate, but sell signals can often be confusing. Nevertheless, following the signals given by the indicator can be profitable. Incidentally, Boston Pizza Royalties Income Fund is presently offering approximately a 6% yield on interest received. |

|
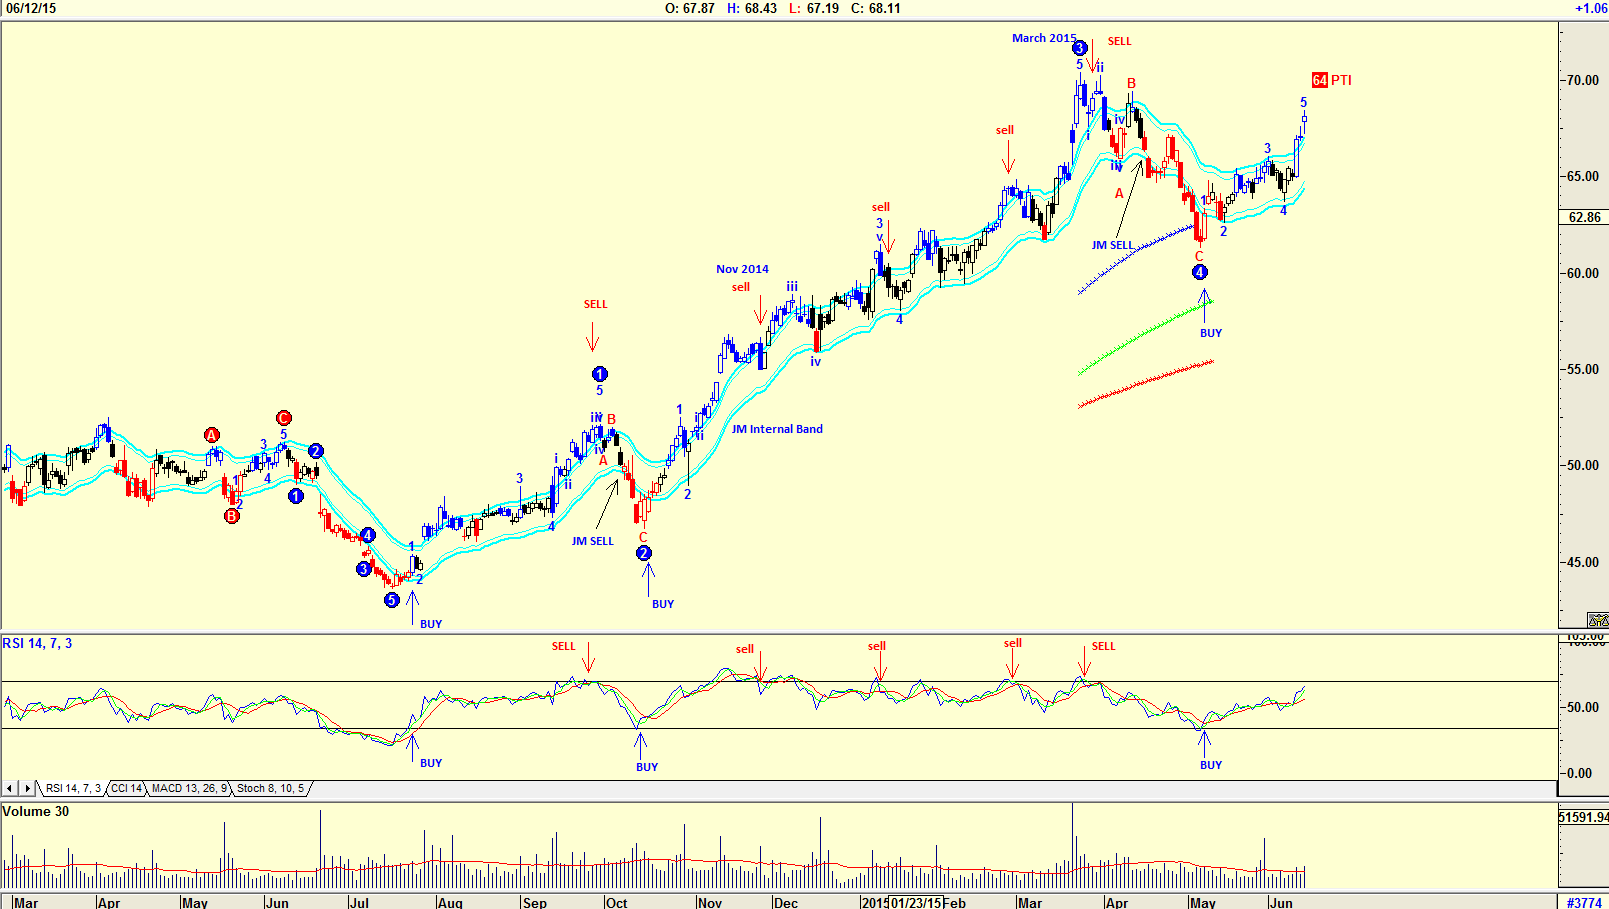
| Figure 2. RSI Buys With JM Internal Band And Elliott Wave. Here there are only three RSI buys and a number of sells. If you had sold in November 2014 you would have regretted your decision. |
| Graphic provided by: AdvancedGET. |
| |
| The chart in Figure 2 of Darden Restaurants shows only three RSI buys and a number of sells, showing the accuracy of the buy signals, and the inaccuracy of the sell signals. Had you sold in November 2014 as suggested by the RSI, you would have regretted it. This is the reason why I personally use the JM Internal Band indicator to confirm a sell signal. The JM Internal Band indicator is a 15-period simple moving average offset by 2% positive and 2% negative. Admittedly the sell signals suggested by the JM internal band indicator are later than those suggested by the RSI, but the JM internal band is acting as a stop loss indicator. There are many other indicators available that can be used as a stop loss indicator. Note the Elliott wave count on the chart is suggesting that the stock price should rise in a WAVE 5. The probability indicator (PTI) is 65%. |

|
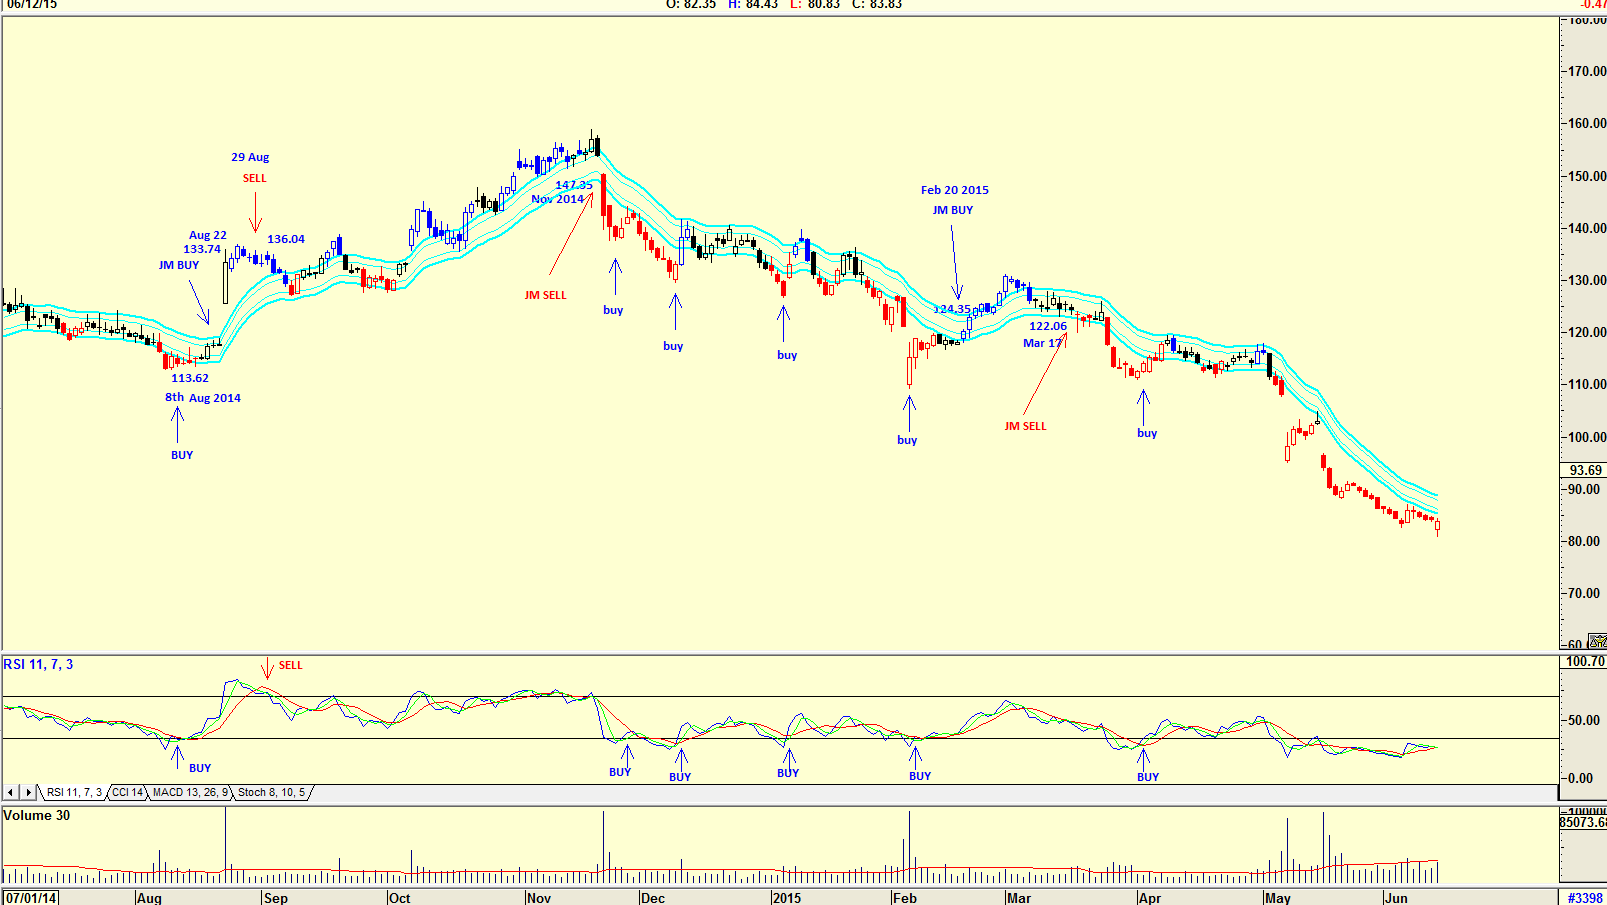
| Figure 3. RSI Failure And JM Internal Band. The RSI is a reliable indicator but it doesn't work all the time. Here you see how it can throw you off. |
| Graphic provided by: AdvancedGET. |
| |
| The chart of Keurig Green Mountain Coffee (GMCR) in Figure 3 is an example of this. The RSI gave a buy on August 8, 2014 at $113.62 and a sell on August 29, 2014 at $136.04. Following the JM internal band indicator, you would have bought the stock on August 22, 2014 at $133.74, $20 higher than the buy given by the RSI. However, you would have sold in November 2014 at $147.35 giving you a profit of $13.61. The JM buy suggested on February 20, 2015 would have resulted in a loss. The RSI is, in my opinion, probably one of the best indicators out there suggesting when to buy a stock. Using the RSI, or any other indicator for that matter, can often be profitable, but there are times when they simply do not work, and lead to losses. That is where developing an efficient stop loss indicator is necessary, and the JM internal band indicator provides exactly that. |
Has been a technical analyst since 1969, and has worked as a futures and options trader with First Financial Futures in Johannesburg, South Africa.
| Address: | 3256 West 24th Ave |
| Vancouver, BC | |
| Phone # for sales: | 6042634214 |
| E-mail address: | petroosp@gmail.com |
Click here for more information about our publications!
Comments

Request Information From Our Sponsors
- StockCharts.com, Inc.
- Candle Patterns
- Candlestick Charting Explained
- Intermarket Technical Analysis
- John Murphy on Chart Analysis
- John Murphy's Chart Pattern Recognition
- John Murphy's Market Message
- MurphyExplainsMarketAnalysis-Intermarket Analysis
- MurphyExplainsMarketAnalysis-Visual Analysis
- StockCharts.com
- Technical Analysis of the Financial Markets
- The Visual Investor
- VectorVest, Inc.
- Executive Premier Workshop
- One-Day Options Course
- OptionsPro
- Retirement Income Workshop
- Sure-Fire Trading Systems (VectorVest, Inc.)
- Trading as a Business Workshop
- VectorVest 7 EOD
- VectorVest 7 RealTime/IntraDay
- VectorVest AutoTester
- VectorVest Educational Services
- VectorVest OnLine
- VectorVest Options Analyzer
- VectorVest ProGraphics v6.0
- VectorVest ProTrader 7
- VectorVest RealTime Derby Tool
- VectorVest Simulator
- VectorVest Variator
- VectorVest Watchdog
