

HOT TOPICS LIST
- MACD
- Fibonacci
- RSI
- Gann
- ADXR
- Stochastics
- Volume
- Triangles
- Futures
- Cycles
- Volatility
- ZIGZAG
- MESA
- Retracement
- Aroon
INDICATORS LIST
LIST OF TOPICS
PRINT THIS ARTICLE
by Donald W. Pendergast, Jr.
After a 69-month long bull run, shares of Coca-Cola Co. have finally entered a major corrective pattern.
Position: N/A
Donald W. Pendergast, Jr.
Freelance financial markets writer and online publisher of the Trendzetterz.com S&P 500 Weekly Forecast service.
PRINT THIS ARTICLE
CYCLES
Multiyear Bull Run Terminates At Coca-Cola Co.
06/17/15 02:12:23 PMby Donald W. Pendergast, Jr.
After a 69-month long bull run, shares of Coca-Cola Co. have finally entered a major corrective pattern.
Position: N/A
| Compared to some other large-cap stocks in the S&P 500 index (.SPX, SPY), shares of Coca-Cola Co. (KO) experienced less stellar bull market gains — up by 140% between March 2009 and November 2014 — but considering the stock hails from the typically nonvolatile consumer staples sector, the stock has to surely be considered a big winner. All bull markets eventually correct, and by all measures, a major correction and/or bearish trend reversal is already underway in KO — and with more downside to come in 2015. Here's a closer look now. |
|
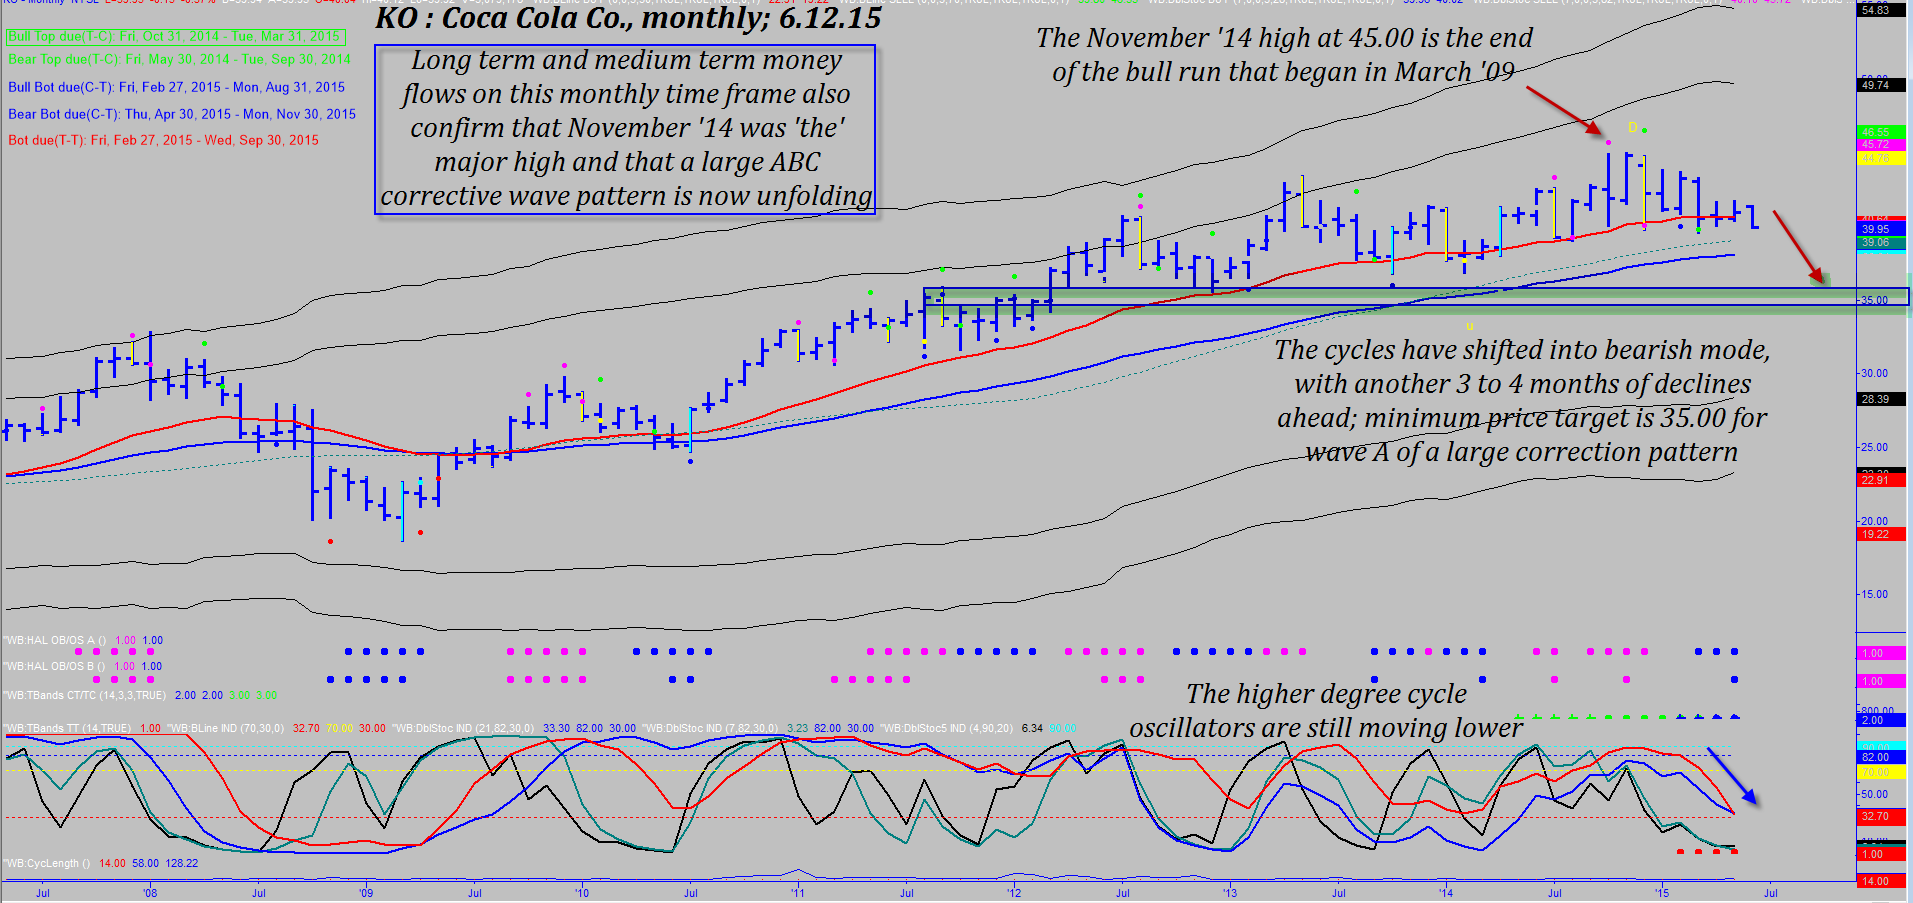
| Figure 1. Monthly Chart Of Coca Cola Co. (KO). The November 2014 cycle high at 45.00 was the end of the 69-month long bull run in this widely-followed consumer staples stock. The next major demand (support) zone is near 35.00. |
| Graphic provided by: TradeStation. |
| Graphic provided by: ProfitTrader7 from www.walterbressert.com. |
| |
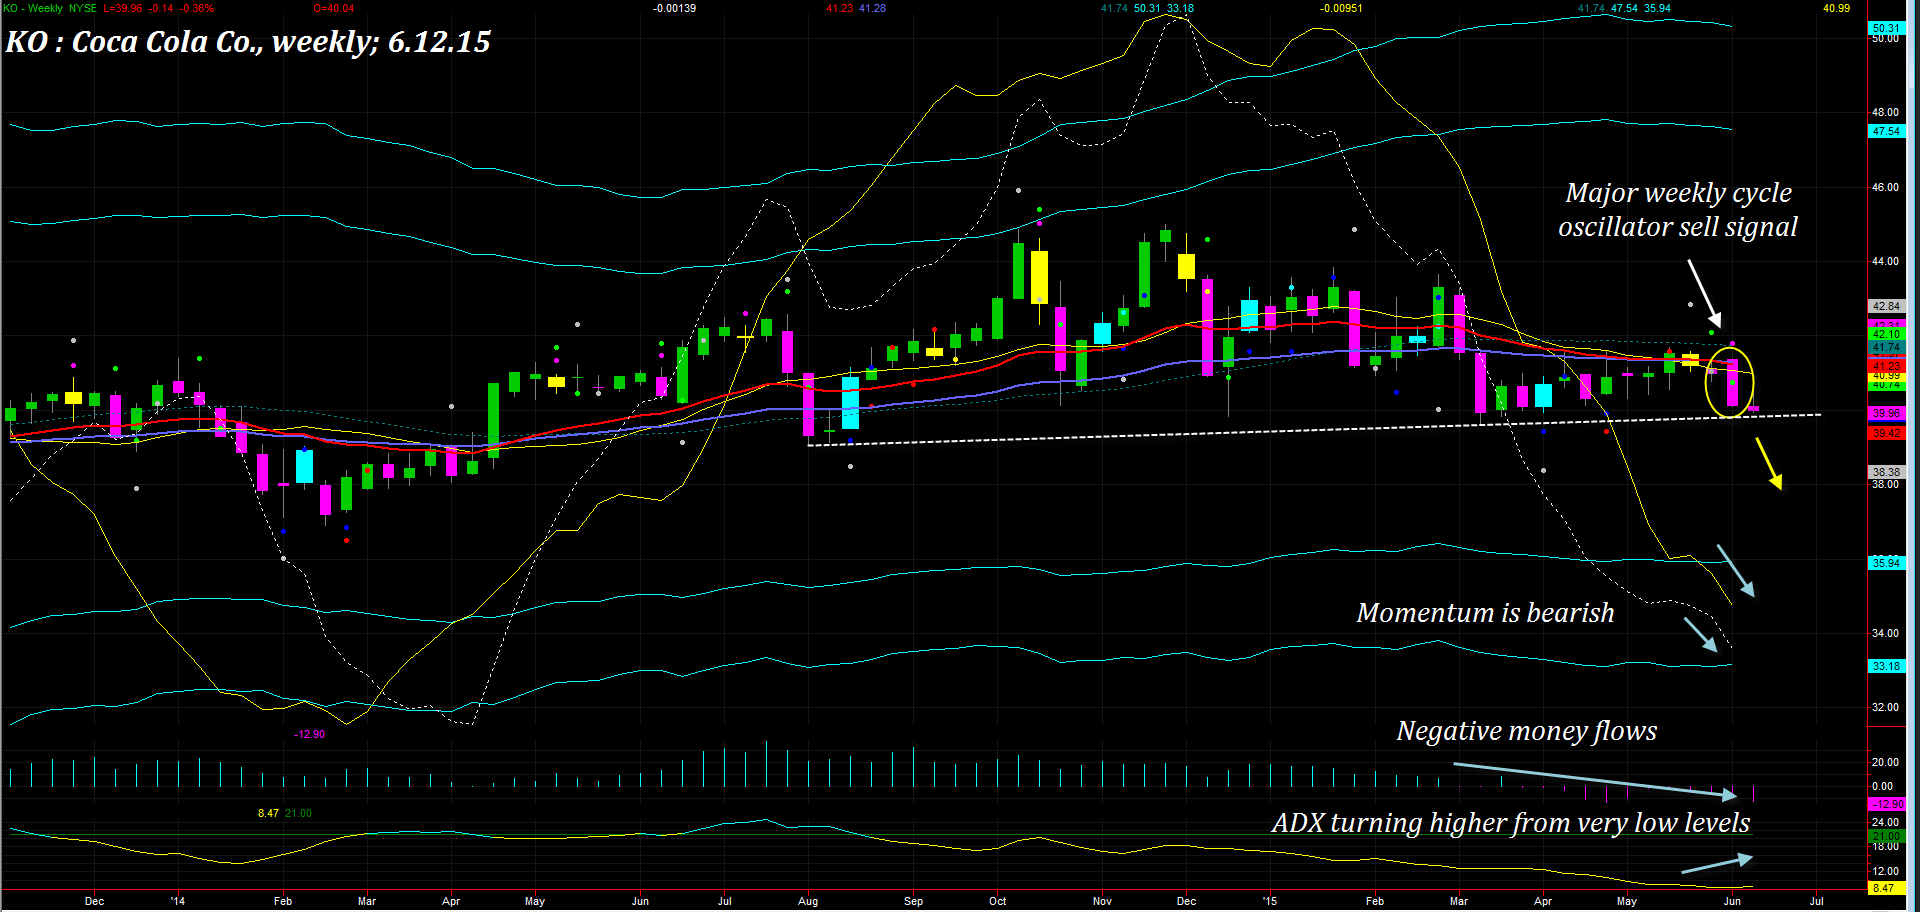
| Secular bull markets always have more resiliency and long term staying power than is believed normally possible, continuing to grind consistently higher despite periodic technical corrections, global political and economic shocks, and the like. Of course, that Coca-Cola's core business is essentially recession-proof is also a big factor in its healthy stock performance. However, all big trends finally fizzle and this emerging correction/trend reversal certainly looks to be "the real thing" and here's why the line of least resistance for KO is toward lower prices for at least the next few months: 1. Monthly chart cycle analysis (Figure 1) confirms the shift from bullish translation to bearish translation, with the next 14-month cycle low not due until later this summer and possibly not until mid-fall 2015. 2. The 13-, 21-, 34- and 89-month Chaikin money flow histograms (not shown) all confirm that the "smart money" was cashing in during the final run higher into the November 2014 high at 45.00. Not surprisingly, when all that's left to drive a stock higher is the average retail trader (about 20% of all stock market volume), it doesn't take too long for the tables to be turned, with the same smart money cash-ins now becoming active short sellers, eating the retail trader's lunch. They'll likely be enjoying a Coca-Cola beverage with their lunch perhaps, at least for the next few months until KO hits a cycle low near major support near $35.00. 3. The weekly chart (Figure 2) reveals a rising 13-period average directional index (ADX); it's rising from an incredibly low reading (below 9.00) and now that a major weekly cycle oscillator sell signal triggered last week (on June 11, 2015) this could be a potent short selling setup to watch for follow through. 4. Both of the high-degree monthly chart cycle oscillators are also in full bearish mode and may not bottom until late summer/early fall 2015 at the earliest. 5. Note that KO is right on top of an important support line on the weekly chart (white dashed line near $39.00) and that both momentum spread lines and the weekly money flow histogram (CMF)(21) are all in bearish mode. |
|
| Figure 2. Weekly Chart Of KO. KO's critical support line is on the verge of a major breakdown at a time of negative money flows and increasingly bearish momentum. |
| Graphic provided by: TradeStation. |
| Graphic provided by: ProfitTrader7 from www.walterbressert.com. |
| |
| Be aware that many other large cap stocks (from nearly every sector) are manifesting similar patterns of monthly cycles topping and/or bearish cycle shifts and weekly chart pattern breakdowns; it does appear that the entire S&P 500 index is going to have a rough summer here in 2015, so be sure you are actively protecting any long-term bullish stock positions in your portfolio with put options. Speculative bears can buy puts in KO once the white support line is broken as long as such options have at least six months of time value and profits are taken on a decline toward the next strong demand (support) area near 35.00. Trade wisely until we meet here again and get ready for some powerful declines over the next several months, if not into 2016. |
Freelance financial markets writer and online publisher of the Trendzetterz.com S&P 500 Weekly Forecast service.
| Title: | Market consultant and writer |
| Company: | Trendzetterz |
| Address: | 81 Hickory Hollow Drive |
| Crossville, TN 38555 | |
| Phone # for sales: | 904-303-4814 |
| Website: | trendzetterz.com |
| E-mail address: | support@trendzetterz.com |
Traders' Resource Links | |
| Trendzetterz has not added any product or service information to TRADERS' RESOURCE. | |
Click here for more information about our publications!
PRINT THIS ARTICLE

Request Information From Our Sponsors
- StockCharts.com, Inc.
- Candle Patterns
- Candlestick Charting Explained
- Intermarket Technical Analysis
- John Murphy on Chart Analysis
- John Murphy's Chart Pattern Recognition
- John Murphy's Market Message
- MurphyExplainsMarketAnalysis-Intermarket Analysis
- MurphyExplainsMarketAnalysis-Visual Analysis
- StockCharts.com
- Technical Analysis of the Financial Markets
- The Visual Investor
- VectorVest, Inc.
- Executive Premier Workshop
- One-Day Options Course
- OptionsPro
- Retirement Income Workshop
- Sure-Fire Trading Systems (VectorVest, Inc.)
- Trading as a Business Workshop
- VectorVest 7 EOD
- VectorVest 7 RealTime/IntraDay
- VectorVest AutoTester
- VectorVest Educational Services
- VectorVest OnLine
- VectorVest Options Analyzer
- VectorVest ProGraphics v6.0
- VectorVest ProTrader 7
- VectorVest RealTime Derby Tool
- VectorVest Simulator
- VectorVest Variator
- VectorVest Watchdog