HOT TOPICS LIST
- MACD
- Fibonacci
- RSI
- Gann
- ADXR
- Stochastics
- Volume
- Triangles
- Futures
- Cycles
- Volatility
- ZIGZAG
- MESA
- Retracement
- Aroon
INDICATORS LIST
LIST OF TOPICS
PRINT THIS ARTICLE
by Koos van der Merwe
Let's take a look at the charts and find out.
Position: Accumulate
Koos van der Merwe
Has been a technical analyst since 1969, and has worked as a futures and options trader with First Financial Futures in Johannesburg, South Africa.
PRINT THIS ARTICLE
TECHNICAL ANALYSIS
Is Costco Wholesale Corp. A Buy?
06/15/15 03:35:52 PMby Koos van der Merwe
Let's take a look at the charts and find out.
Position: Accumulate
| Costco wholesale Corp. (COST), a popular warehouse for shoppers who wish to buy in bulk, continues to win customers because prices are reasonable and affordable. Many investors are not that happy with Costco's business strategy. Some Wall Street analysts assert that the company is overly generous to its customers and employees. Unlike its rivals, COST has not shut out unions. |

|
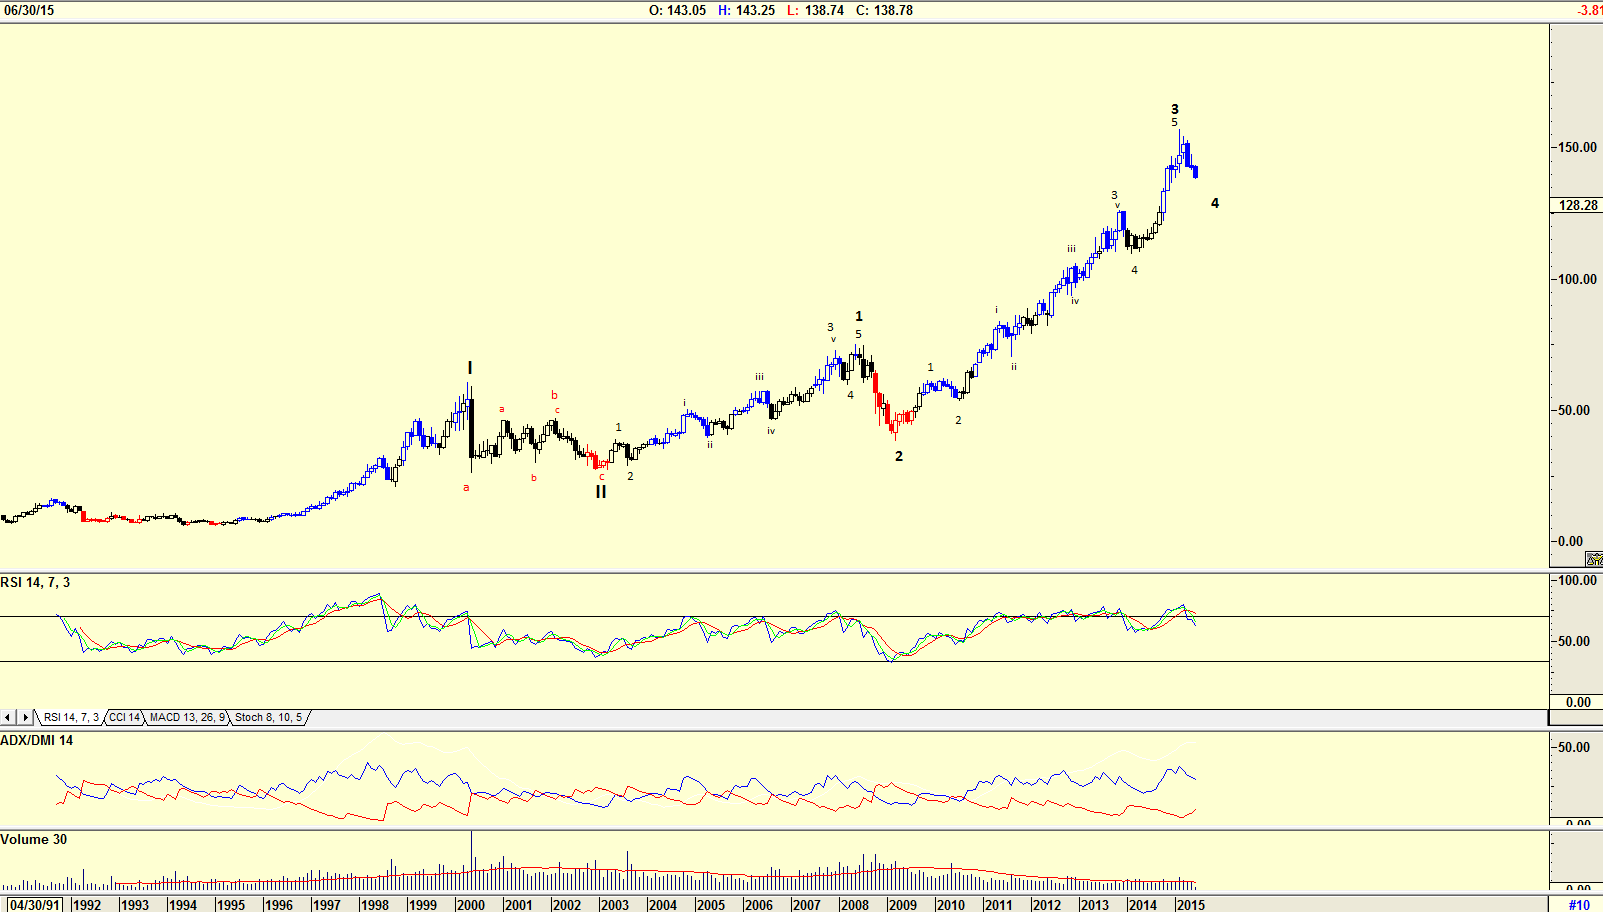
| Figure 1. Monthly Chart With Elliott Wave Count. The Elliott wave count suggests that the stock is tracing a Wave 4 of a WAVE III. The RSI is suggesting that price still has further to fall. Very likely, the stock price could fall somewhere between $110.57 and $127.35. |
| Graphic provided by: AdvancedGET. |
| |
| The monthly chart of COST in Figure 1 shows how the stock price has risen from a low of $6.50 in February 1995 to a high of $156.85 by February 2015. The Elliott wave count shown suggests that the stock is tracing a Wave 4 of WAVE III. The relative strength index (RSI) on the chart is suggesting that the stock price has still further to fall. The Elliott wave rule that the correction should fall into the region of the 4th Wave of lesser degree, suggests that the stock price should correct to somewhere between $110.57 and $127.35. |

|
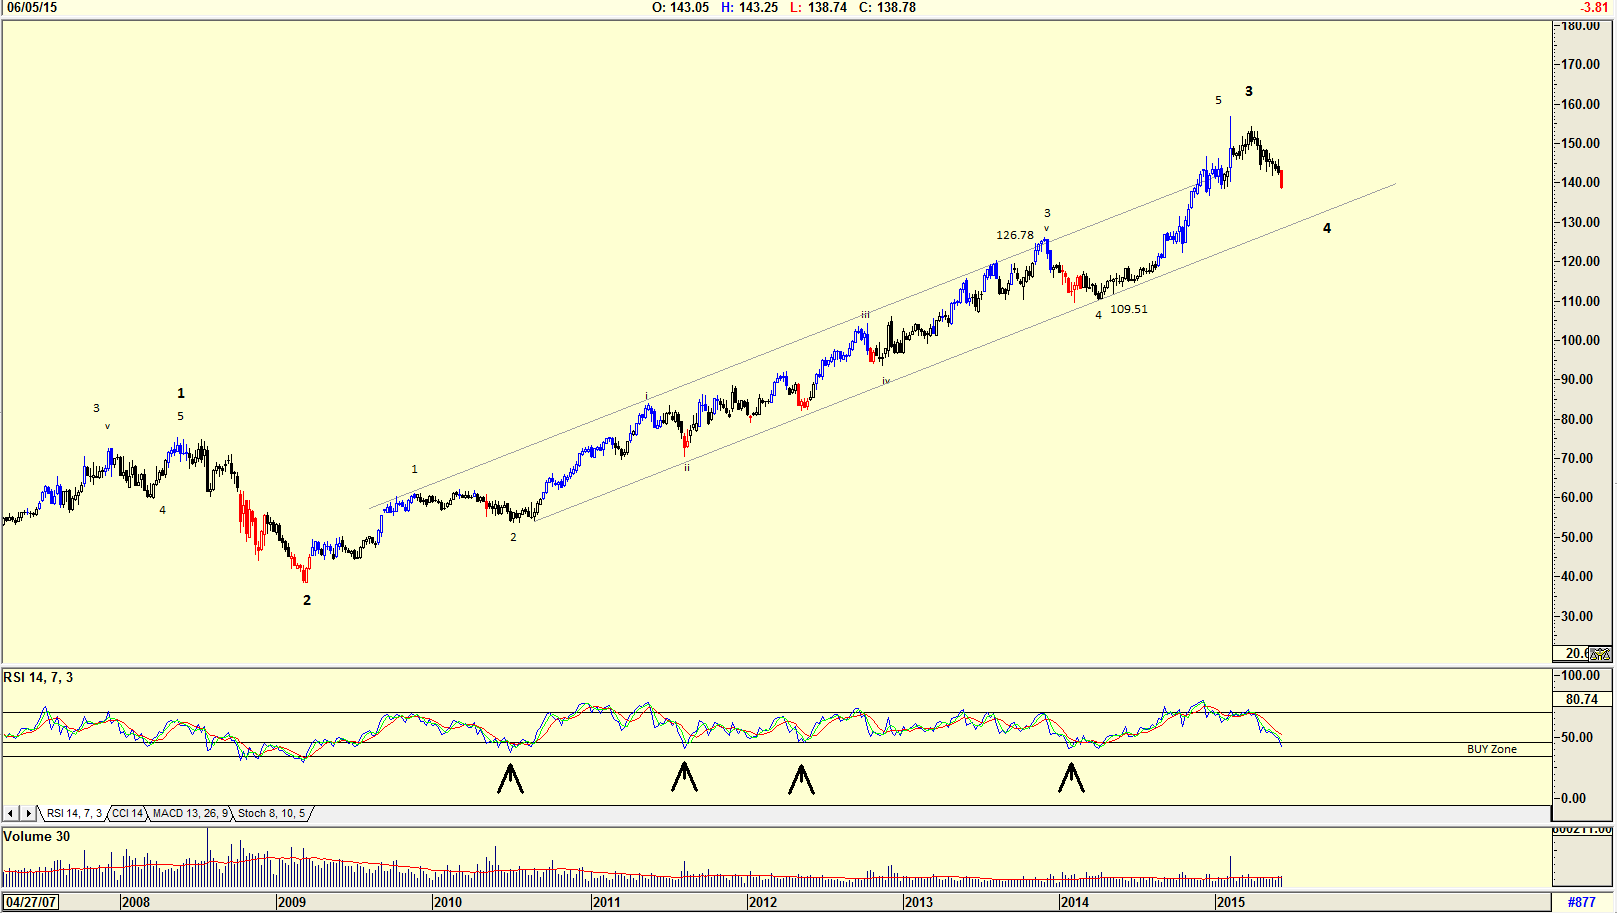
| Figure 2. Weekly Chart With Elliott Wave Count. The stock price is in a wave 4 and could test the support line at $126.78. The RSI is testing the buy zone that has historically given buy signals. |
| Graphic provided by: AdvancedGET. |
| |
| The chart in Figure 2 is a weekly chart with an Elliott wave count that is similar to the monthly chart suggesting that the stock price is in a Wave 4 and could test the support line at $126.78. The RSI is testing the buy zone that has historically given buy signals. |

|
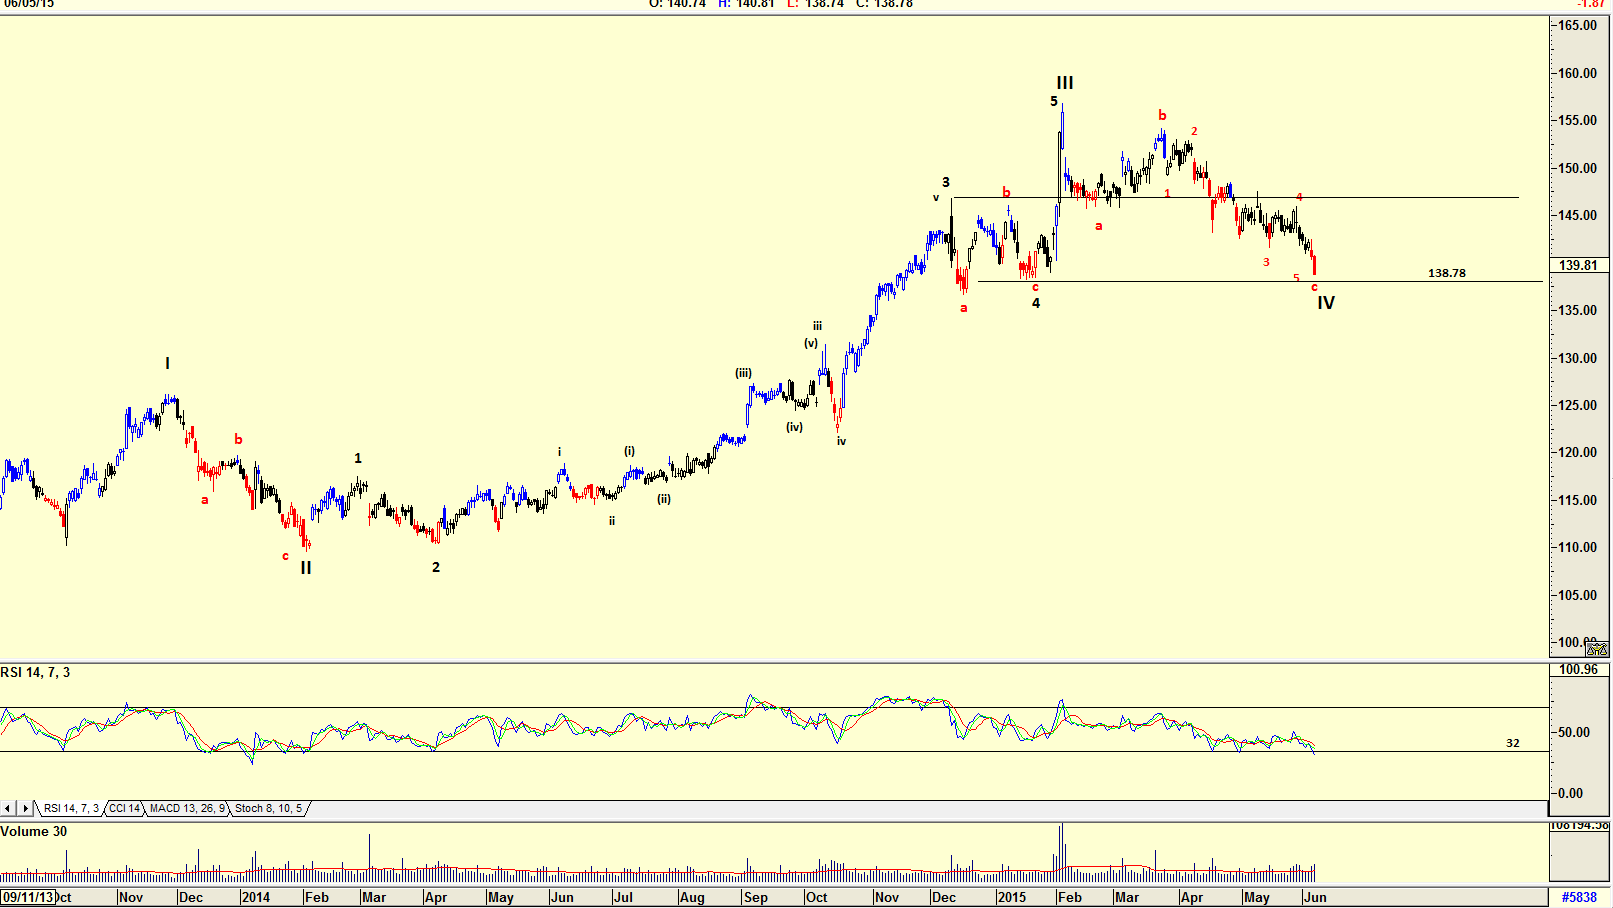
| Figure 3. Daily Chart With Elliott Wave Count. This chart suggests that WAVE IV is almost complete and the RSI is at oversold levels. This suggests that a buy signal could soon be given. |
| Graphic provided by: AdvancedGET. |
| |
| The daily chart in Figure 3 is suggesting that WAVE IV is almost complete with the RSI recently falling below the 32 horizontal line at oversold levels. This suggests that a buy signal could soon be given. |

|
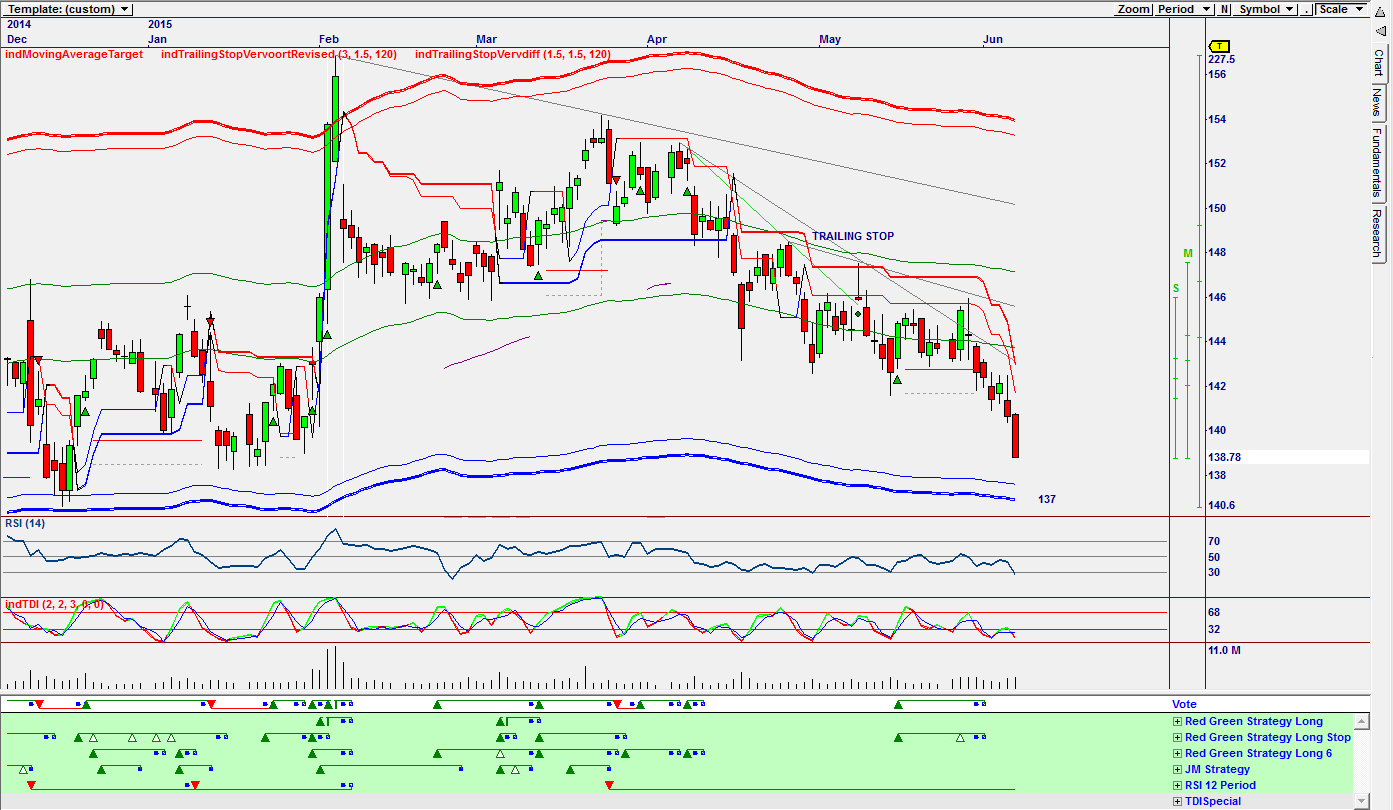
| Figure 4. Omnitrader Chart Suggesting A Buy Target. The chart is suggesting a target of $137, the price at the lower level. |
| Graphic provided by: Omnitrader. |
| |
| The chart in Figure 4 is an Omnitrader chart showing a Vote line that has not yet given a buy signal. The chart is suggesting a target of $137, the price at the lower band. COST is a stock on my watch list, and when the price reaches close to the $137 level and the RSI confirms with a buy signal, I shall be a buyer with a long-term hold. |
Has been a technical analyst since 1969, and has worked as a futures and options trader with First Financial Futures in Johannesburg, South Africa.
| Address: | 3256 West 24th Ave |
| Vancouver, BC | |
| Phone # for sales: | 6042634214 |
| E-mail address: | petroosp@gmail.com |
Click here for more information about our publications!
PRINT THIS ARTICLE

|

Request Information From Our Sponsors
- StockCharts.com, Inc.
- Candle Patterns
- Candlestick Charting Explained
- Intermarket Technical Analysis
- John Murphy on Chart Analysis
- John Murphy's Chart Pattern Recognition
- John Murphy's Market Message
- MurphyExplainsMarketAnalysis-Intermarket Analysis
- MurphyExplainsMarketAnalysis-Visual Analysis
- StockCharts.com
- Technical Analysis of the Financial Markets
- The Visual Investor
- VectorVest, Inc.
- Executive Premier Workshop
- One-Day Options Course
- OptionsPro
- Retirement Income Workshop
- Sure-Fire Trading Systems (VectorVest, Inc.)
- Trading as a Business Workshop
- VectorVest 7 EOD
- VectorVest 7 RealTime/IntraDay
- VectorVest AutoTester
- VectorVest Educational Services
- VectorVest OnLine
- VectorVest Options Analyzer
- VectorVest ProGraphics v6.0
- VectorVest ProTrader 7
- VectorVest RealTime Derby Tool
- VectorVest Simulator
- VectorVest Variator
- VectorVest Watchdog
