HOT TOPICS LIST
- MACD
- Fibonacci
- RSI
- Gann
- ADXR
- Stochastics
- Volume
- Triangles
- Futures
- Cycles
- Volatility
- ZIGZAG
- MESA
- Retracement
- Aroon
INDICATORS LIST
LIST OF TOPICS
PRINT THIS ARTICLE
by Gary Grosschadl
The Nasdaq seems to relish announcing bullish intentions with gaps. If this current gap (11/14/02) doesn't close or start to close in three days, a strong move may be in store.
Position: N/A
Gary Grosschadl
Independent Canadian equities trader and technical analyst based in Peterborough
Ontario, Canada.
PRINT THIS ARTICLE
CHART ANALYSIS
The Nasdaq Powers Higher With Another Gap
11/15/02 01:02:39 PMby Gary Grosschadl
The Nasdaq seems to relish announcing bullish intentions with gaps. If this current gap (11/14/02) doesn't close or start to close in three days, a strong move may be in store.
Position: N/A
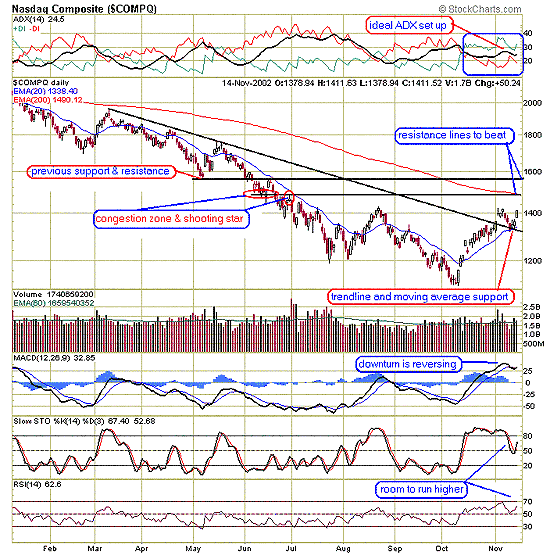
| The previous stab past 1400 was halted by a doji candlestick which was tested again two days later, only to fall back in temporary defeat. The subsequent three day decline was stopped by a combination of trendline support and the 20-day EMA line as shown on chart. |
| This daily chart shows two prominent resistance lines that may challenge this bullish ascent. The first resistance line also corresponds to the 200-day EMA, often a crucial spot. With enough bullish power, the higher resistance line may come into play at 1560. This line represents an area of previous support which turned into future resistance. |

|
| Graphic provided by: stockcharts.com. |
| |
| Traders should note the bullish ADX setup. Once again we have the ideal directional movement scenario where the ADX line is upsloping and DIs are bullishly positioned and spreading. Notice that this is the longest bullish interval (for this chart duration) for the directional movement indicator as shown by the blue rectangle. This uptrend stays intact as long as the green +DI line stays above the red -DI. This is a rough guideline only because small deviations can occur. When a reversal comes there will be collaborating evidence as always from a collective weight of evidence encompassing candlestick patterns, resistance lines, stochastic reversals, moving average violations and more. |
| It remains prudent advice to consider the markets as reversal oriented in these skittish, trying times. Traders should use all their available trusted tools to help decipher the markets including a game plan they can stick to. |
Independent Canadian equities trader and technical analyst based in Peterborough
Ontario, Canada.
| Website: | www.whatsonsale.ca/financial.html |
| E-mail address: | gwg7@sympatico.ca |
Click here for more information about our publications!
Comments
Date: 11/16/02Rank: 5Comment:
Date: 11/19/02Rank: 5Comment:

Request Information From Our Sponsors
- StockCharts.com, Inc.
- Candle Patterns
- Candlestick Charting Explained
- Intermarket Technical Analysis
- John Murphy on Chart Analysis
- John Murphy's Chart Pattern Recognition
- John Murphy's Market Message
- MurphyExplainsMarketAnalysis-Intermarket Analysis
- MurphyExplainsMarketAnalysis-Visual Analysis
- StockCharts.com
- Technical Analysis of the Financial Markets
- The Visual Investor
- VectorVest, Inc.
- Executive Premier Workshop
- One-Day Options Course
- OptionsPro
- Retirement Income Workshop
- Sure-Fire Trading Systems (VectorVest, Inc.)
- Trading as a Business Workshop
- VectorVest 7 EOD
- VectorVest 7 RealTime/IntraDay
- VectorVest AutoTester
- VectorVest Educational Services
- VectorVest OnLine
- VectorVest Options Analyzer
- VectorVest ProGraphics v6.0
- VectorVest ProTrader 7
- VectorVest RealTime Derby Tool
- VectorVest Simulator
- VectorVest Variator
- VectorVest Watchdog
