

HOT TOPICS LIST
- MACD
- Fibonacci
- RSI
- Gann
- ADXR
- Stochastics
- Volume
- Triangles
- Futures
- Cycles
- Volatility
- ZIGZAG
- MESA
- Retracement
- Aroon
INDICATORS LIST
LIST OF TOPICS
PRINT THIS ARTICLE
by Donald W. Pendergast, Jr.
Learning to spot high-probability support/resistance zones in advance can help intraday traders gain a valuable edge in the markets.
Position: N/A
Donald W. Pendergast, Jr.
Freelance financial markets writer and online publisher of the Trendzetterz.com S&P 500 Weekly Forecast service.
PRINT THIS ARTICLE
VOLUME
AAPL: Spotting Potential Reversal Zones In Advance
06/11/15 06:18:31 PMby Donald W. Pendergast, Jr.
Learning to spot high-probability support/resistance zones in advance can help intraday traders gain a valuable edge in the markets.
Position: N/A
| Intraday trading is perfect for those who seek to profit from high volatility, high volume, large cap stocks without having to worry about holding positions overnight; there are a zillion ways to day trade, but almost all of them can be greatly improved by making the most of the major support/resistance (demand/supply) price zones that a stock may be anticipated to interact with during the course of a trading day. Here's a closer look at one way to use a volume-profile style chart to help identify a potential demand zone, initiate trades, and take profits at a likely supply zone — using intraday charts of Apple Inc. (AAPL) as a guide. |
|
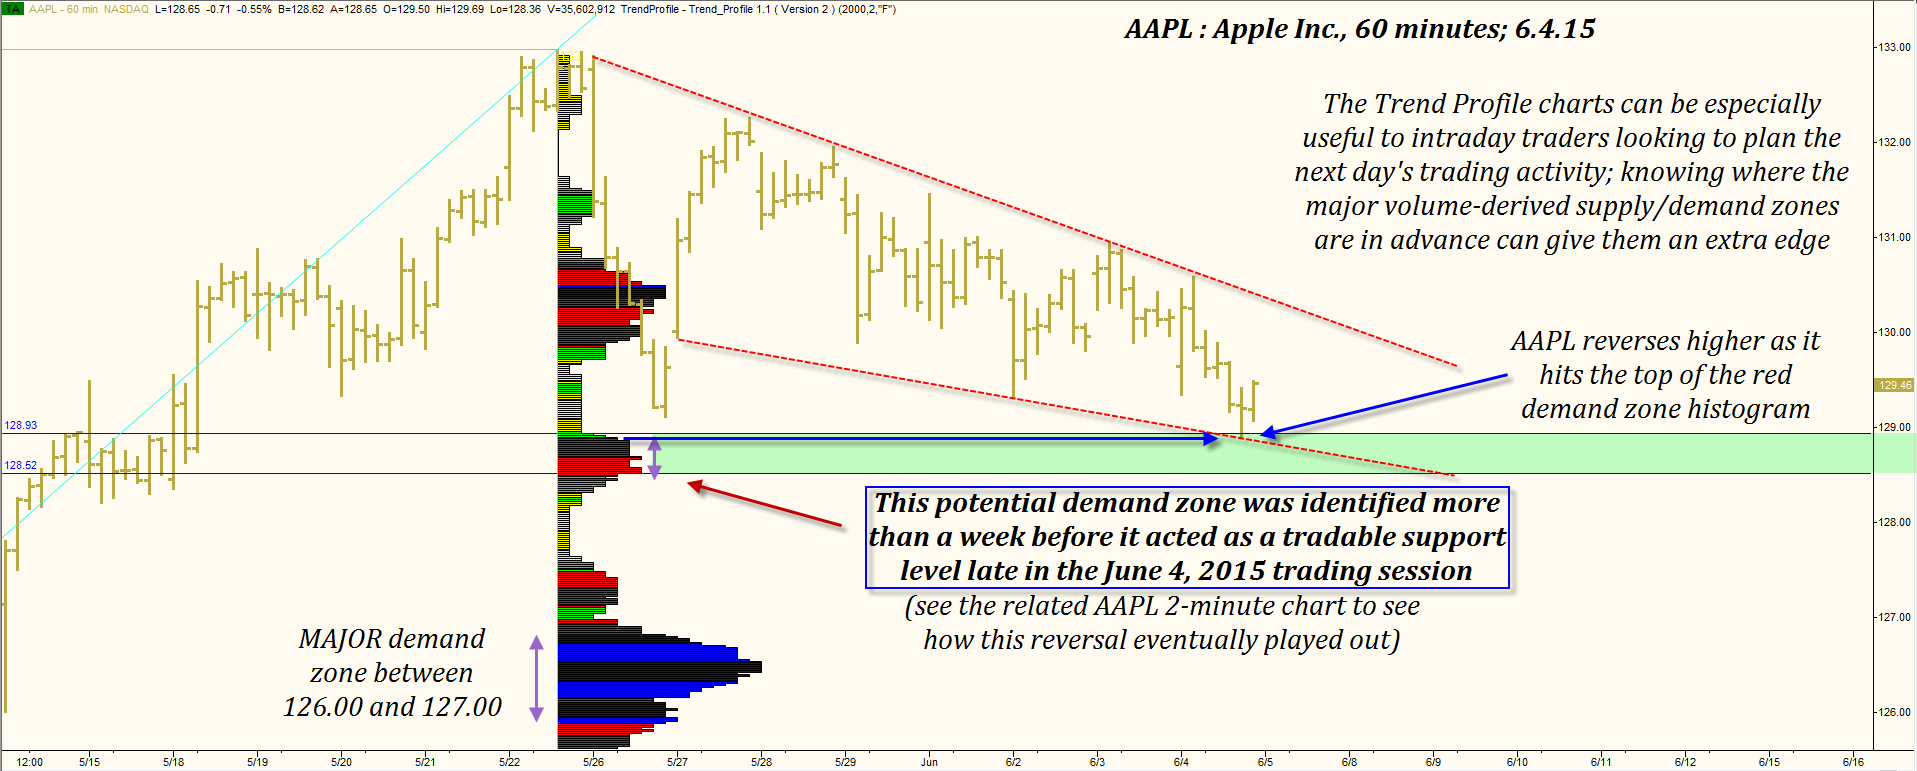
| Figure 1. 60-minute Chart Of Apple, Inc. (AAPL). The demand (support) area defined by the red histogram between 128.55 and 128.95 was observable a full two weeks before AAPL actually touched that price zone and experienced a bullish intraday reversal. |
| Graphic provided by: TradeStation. |
| Graphic provided by: Trend Profile from www.trading-algo.com. |
| |
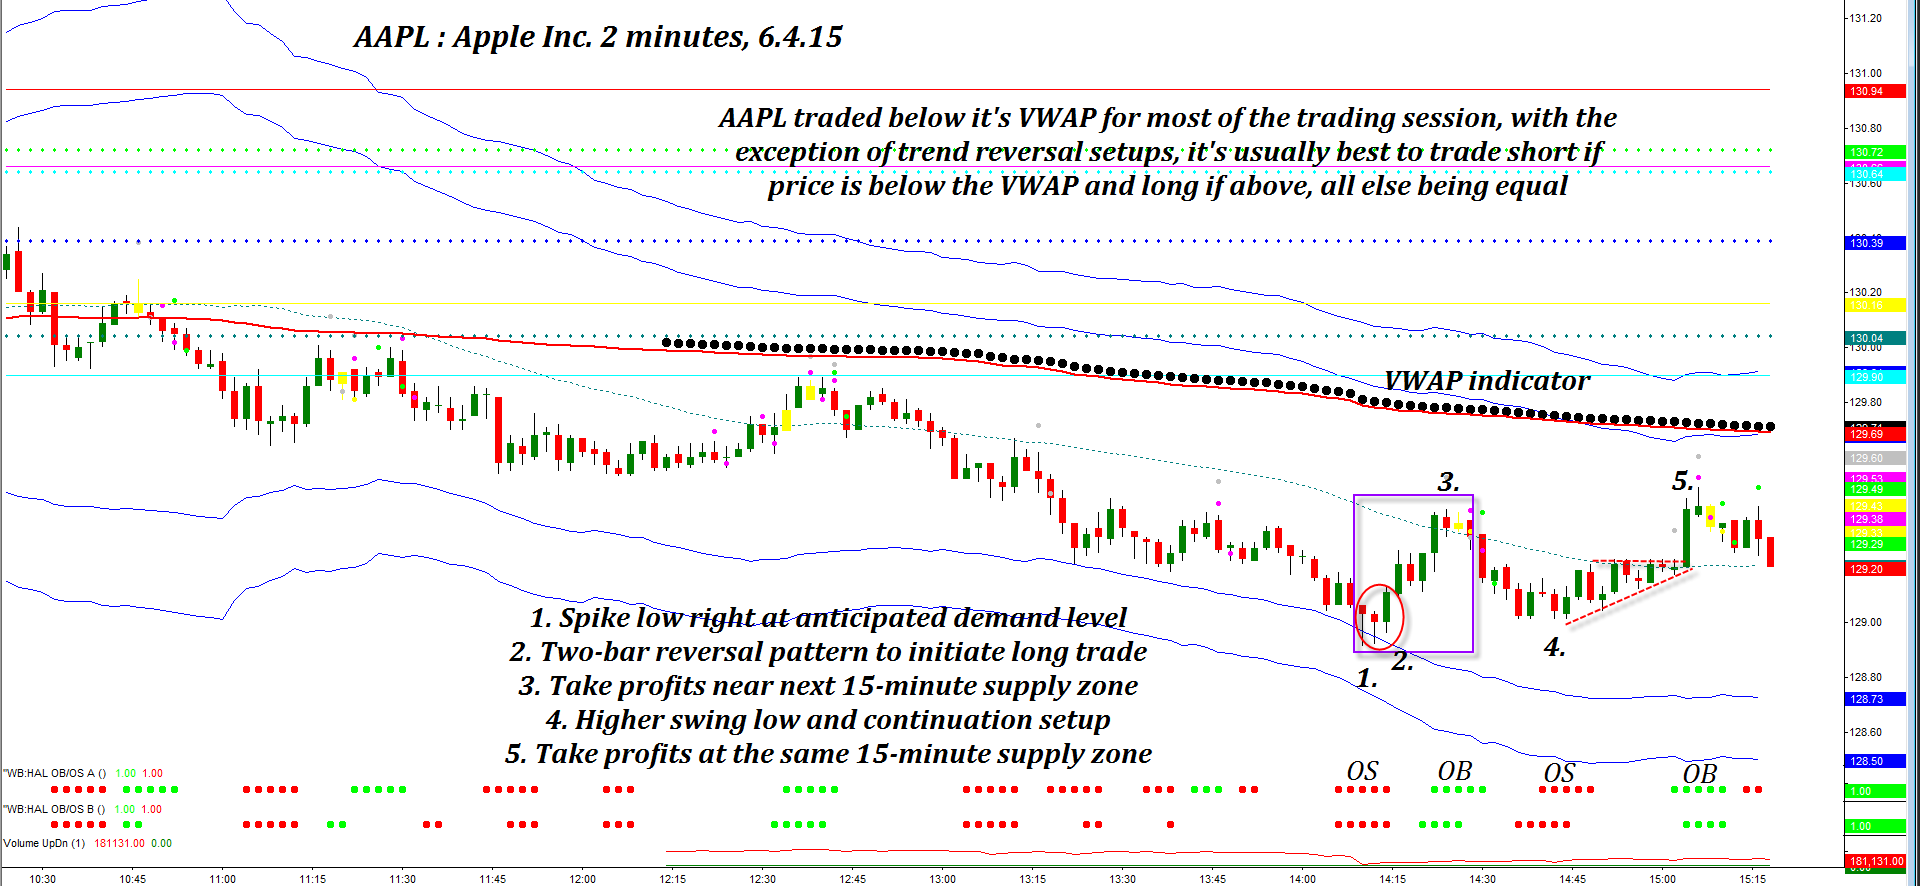
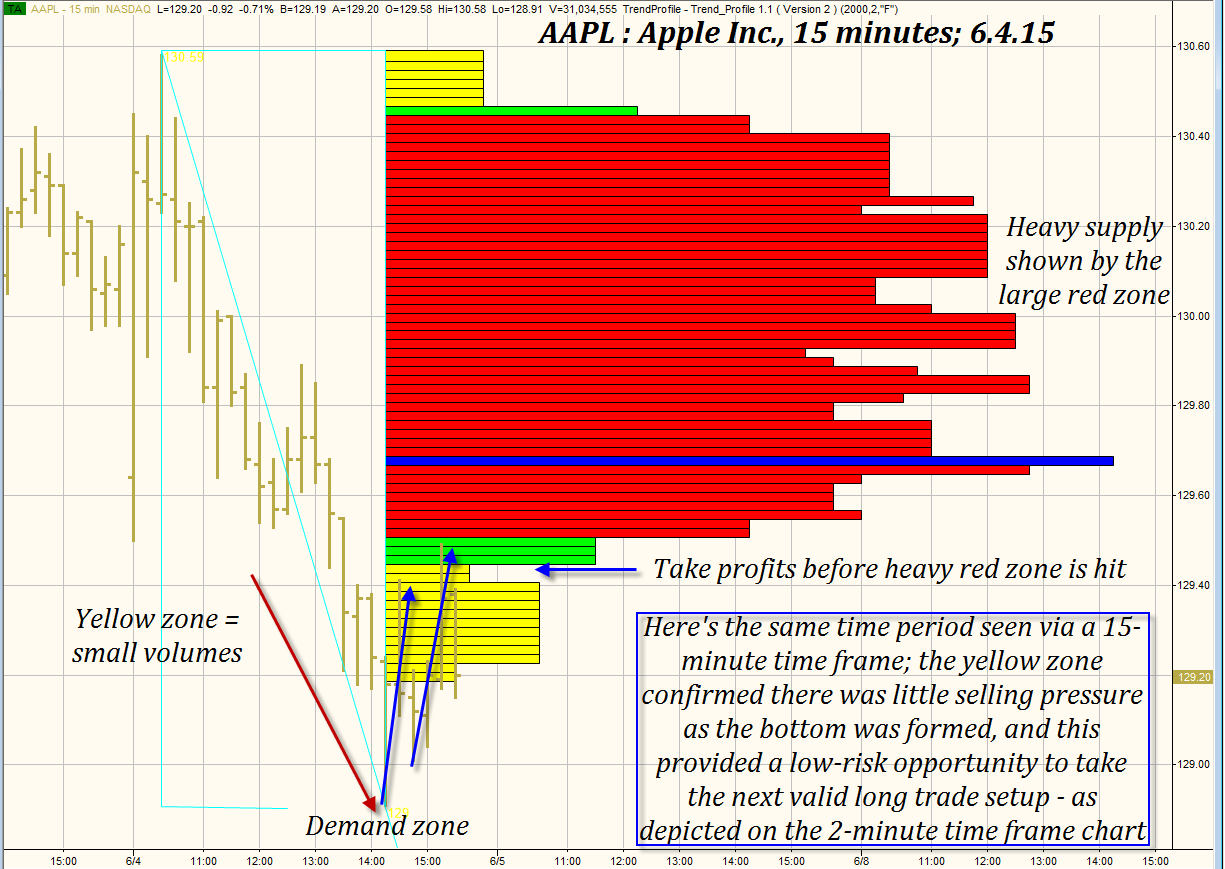
| Day and swing traders can learn much every trading day by plotting a 60-minute Trend Profile chart for the stock(s) they plan to trade the next session; the hourly chart in Figure 1 for AAPL revealed as far back as May 22, 2015 that there were several high-probability demand (support) zones at the following price levels: A. 129.85 to 130.75 (wide red/blue histogram) B. 128.55 to 128.95 (red histogram that is the focus of this article) C. A major demand zone between 126.00 and 127.00 Having worked with the Trend Profile charts for several months now, I am constantly amazed at how well they define "real world" support/resistance zones on a variety of large-cap stocks, indexes, and exchange traded funds. Using these charts in TradeStation 9.1 has revolutionized the way I analyze — and trade — the markets. Therefore, as I saw AAPL descend close to the noticeable red histogram just below 129.00, I began to check other key indicators to prepare for a possible bullish reversal trade setup: 1. My intraday range bar chart was heading into its regular 18-period cycle low. 2. The stock was in an oversold indicator zone (green dotes below price bars on two-minute chart). 3. The long tails on my two-minute APPL bar chart (Figure 2) provided visual confirmation that this was indeed the start of a demand zone. 4. All of this was occurring near a lower Keltner band on the two-minute chart; many powerful reversals occur near these volatility bands. 5. Next, a two-bar reversal pattern occurred (the highest high of the previous two bars was exceeded) and this was my call to enter a long trade position. 6. AAPL rapidly shifted into upside mode; I already had a profit target identified by looking at my 15-minute Trend Profile chart (Figure 3) which suggested that the start of the heavy red supply zone near 129.50 would be an ideal exit zone. I exited near 129.39 just to be safe — pushing trades like this to the limit can result in a lot of lost open profit if things turn bad without warning, after all. APPL did run a few cents higher, ultimately stalling out at 129.41. So, the trade netted 30 cents or about .23% in 10 minutes. The next trade was also a long one; since I already knew the previous low was significant, once a higher low formed it was time to look for the next entry trigger. I put on about 1/3 of my long position on another two-bar reversal and then added the remaining portion once APPL broke above a beautiful congestion zone at 129.24. I exited a few minutes later at 129.45 as APPL made a strong push higher on a single two-minute bar. With an average cost of 129.21 for the position, this made for a .185% profit in about 24 minutes. Both of these trades were taken because the Trend Profile chart had accurately identified a significant demand zone, one that gave me a usable edge and added confidence. |
|
| Figure 2. Two-minute Chart Of AAPL. Here you see a play by play analysis of a successful pair of trend reversal trades built upon the identification of a powerful demand area located just below 129.00. |
| Graphic provided by: TradeStation. |
| Graphic provided by: ProfitTrader7 from www.walterbressert.com. |
| |
| Day trading is a game of science, experience, and intuition to be sure, but if you can add to this mix a highly reliable method of identifying key supply/demand zones in advance, well, the game gets a whole lot easier, more fun, and more profitable. Trade wisely until we meet here again. |
|
| Figure 3. 15-minute Trend Profile Chart of AAPL. Here you see that the lower end of the heavy red supply zone was a good place to take profits on the two long trades described here. Note how price retraced once it got close to this red zone. |
| Graphic provided by: TradeStation. |
| Graphic provided by: Trend Profile from www.trading-algo.com. |
| |
Freelance financial markets writer and online publisher of the Trendzetterz.com S&P 500 Weekly Forecast service.
| Title: | Market consultant and writer |
| Company: | Trendzetterz |
| Address: | 81 Hickory Hollow Drive |
| Crossville, TN 38555 | |
| Phone # for sales: | 904-303-4814 |
| Website: | trendzetterz.com |
| E-mail address: | support@trendzetterz.com |
Traders' Resource Links | |
| Trendzetterz has not added any product or service information to TRADERS' RESOURCE. | |
Click here for more information about our publications!
PRINT THIS ARTICLE

Request Information From Our Sponsors
- StockCharts.com, Inc.
- Candle Patterns
- Candlestick Charting Explained
- Intermarket Technical Analysis
- John Murphy on Chart Analysis
- John Murphy's Chart Pattern Recognition
- John Murphy's Market Message
- MurphyExplainsMarketAnalysis-Intermarket Analysis
- MurphyExplainsMarketAnalysis-Visual Analysis
- StockCharts.com
- Technical Analysis of the Financial Markets
- The Visual Investor
- VectorVest, Inc.
- Executive Premier Workshop
- One-Day Options Course
- OptionsPro
- Retirement Income Workshop
- Sure-Fire Trading Systems (VectorVest, Inc.)
- Trading as a Business Workshop
- VectorVest 7 EOD
- VectorVest 7 RealTime/IntraDay
- VectorVest AutoTester
- VectorVest Educational Services
- VectorVest OnLine
- VectorVest Options Analyzer
- VectorVest ProGraphics v6.0
- VectorVest ProTrader 7
- VectorVest RealTime Derby Tool
- VectorVest Simulator
- VectorVest Variator
- VectorVest Watchdog