HOT TOPICS LIST
- MACD
- Fibonacci
- RSI
- Gann
- ADXR
- Stochastics
- Volume
- Triangles
- Futures
- Cycles
- Volatility
- ZIGZAG
- MESA
- Retracement
- Aroon
INDICATORS LIST
LIST OF TOPICS
PRINT THIS ARTICLE
by Koos van der Merwe
Warren Buffett is well known to all who invest. In fact, when he speaks, everyone listens.
Position: Accumulate
Koos van der Merwe
Has been a technical analyst since 1969, and has worked as a futures and options trader with First Financial Futures in Johannesburg, South Africa.
PRINT THIS ARTICLE
TECHNICAL ANALYSIS
Buffett's Interest
06/08/15 04:41:30 PMby Koos van der Merwe
Warren Buffett is well known to all who invest. In fact, when he speaks, everyone listens.
Position: Accumulate
| Buy & hold — everybody knows that this is Warrens Buffett's strategy, and many investors, not traders mind you, follow that strategy. The strategy works even better when the stocks held have dividends or interest payments that steadily increase over the years. Four stocks that recently made the headlines as favorites for the buy & hold strategy are shown in the charts displayed in Figure 1 to Figure 4. |

|
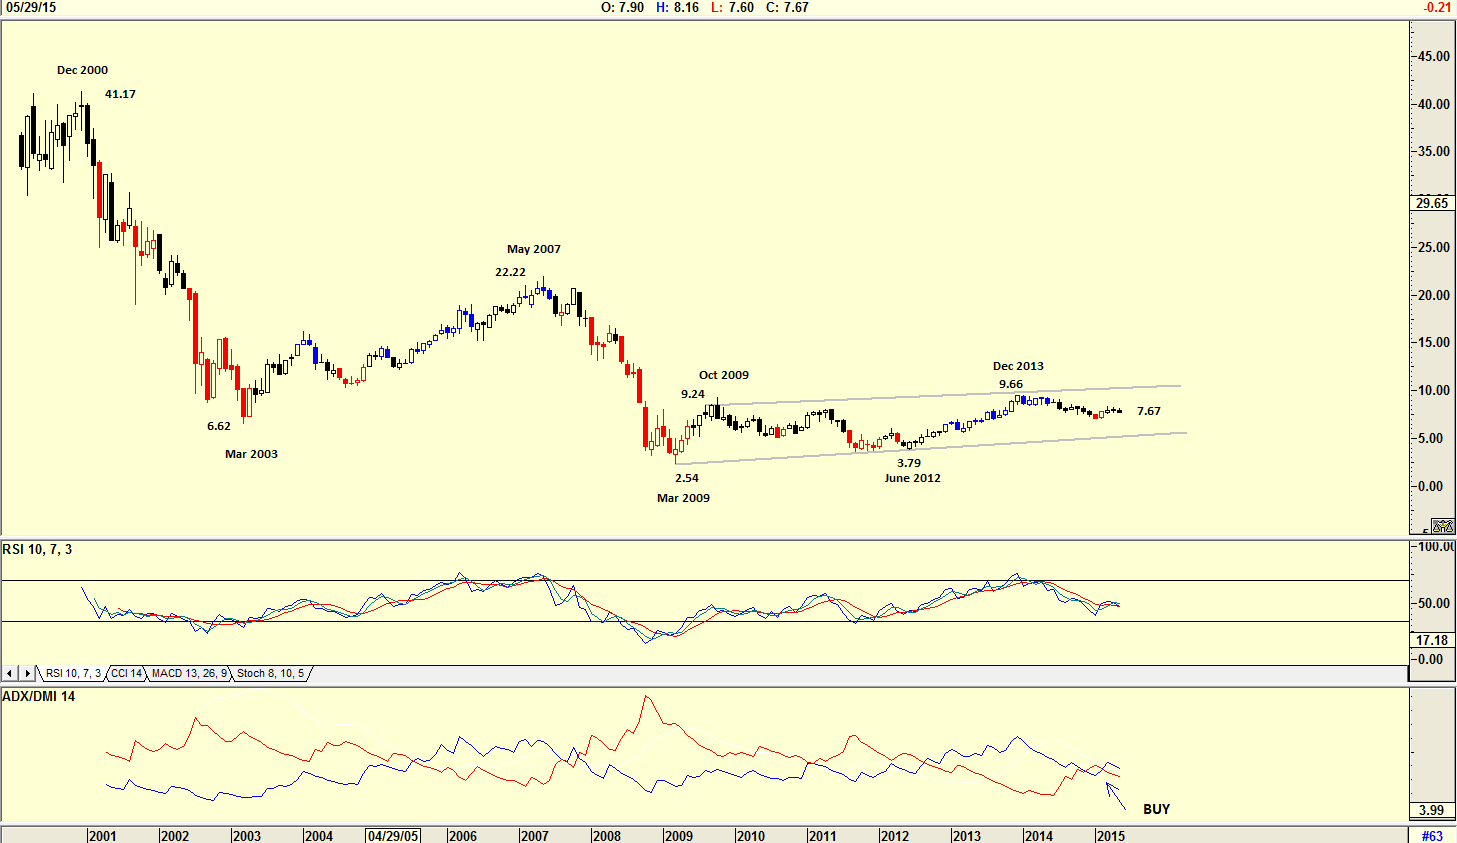
| Figure 1. Monthly Chart Of Aegon NV. Since March 2009 this stock has been slowly recovering. This could possibly be a long-term buy. |
| Graphic provided by: AdvancedGET. |
| |
| Aegon NV is a multinational life insurance, pensions, and asset management company headquartered in The Hague, Netherlands. At the end of 2014, Aegon employed approximately 28,000 people worldwide, serving millions of customers. Aegon's roots go back more than 150 years. Today Aegon is one of the world's leading financial services organizations providing life insurance, pensions, and asset management. Their total dividend for the financial year 2014 is Euro 0.23 per common share. The chart in Figure 1 is a monthly chart showing how the share price had fallen from $41.17 in December 2000 to a low of $2.54 by March 2009. The share has since slowly recovered and is presently trading at $7.67. On the monthly chart, the relative strength index (RSI) is not suggesting a buy but the ADX/DMI indicator is. This is a share you could possibly buy for a long-term buy & hold. |

|
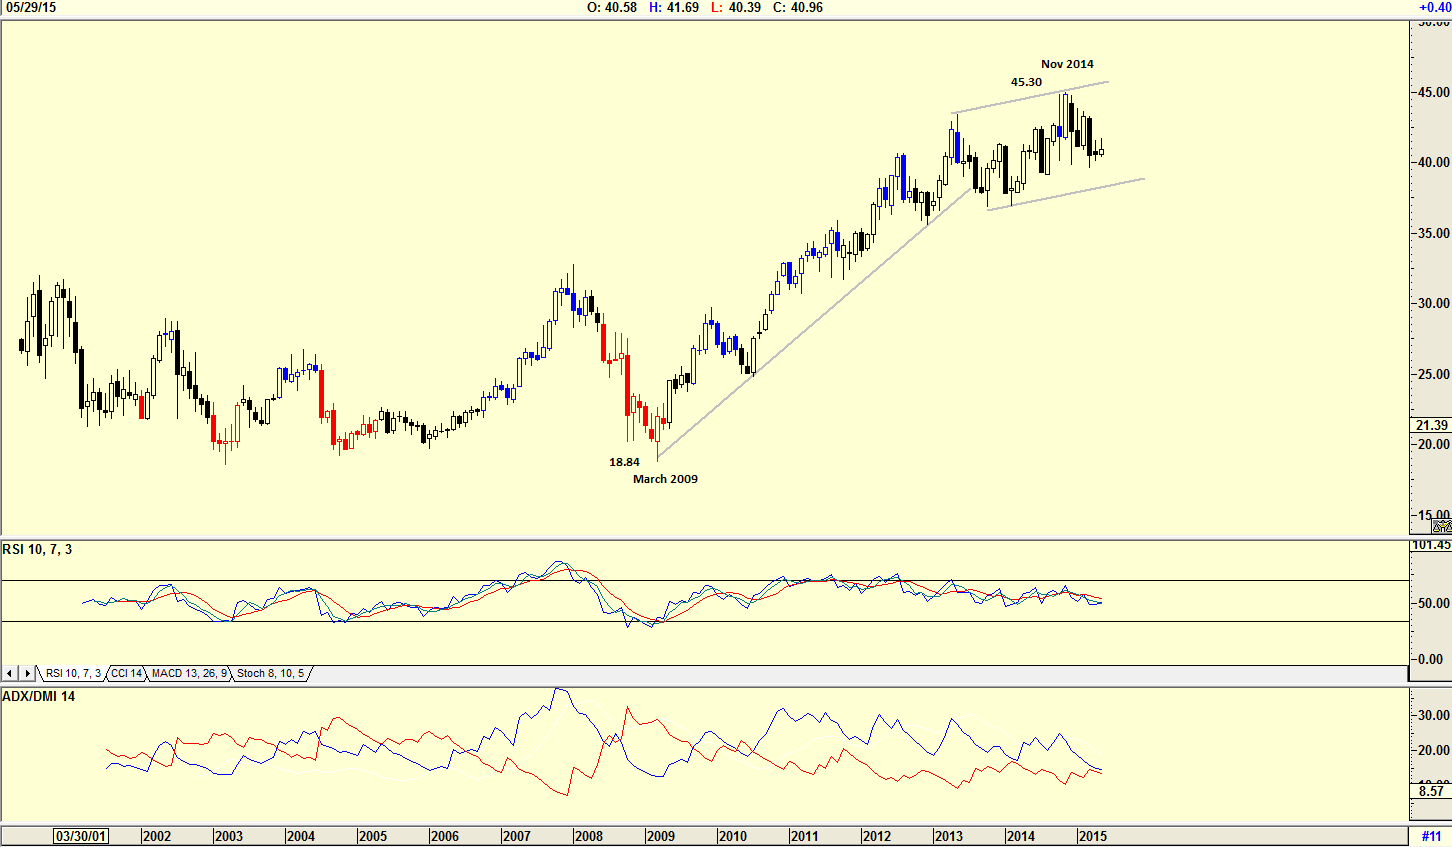
| Figure 2. Monthly Chart Of Coca Cola (KO). When the RSI or hte ADX/DMI indicator suggests a buy, this could be a potential long-term buy candidate. |
| Graphic provided by: AdvancedGET. |
| |
| The chart in Figure 2 is a monthly chart of The Coca Cola Co. (KO) showing how the share price has risen from a low of $18.84 in March 2009 to a high of $45.30 by November 2014. The share price is presently trading at $40.96. The RSI is trending down, and the ADX/DMI indicator is still in a sell mode, suggesting that further downside is still on the cards. The company has declared a cash dividend of 33 cents payable on July 1, 2015. When the RSI or the ADX/DMI indicator suggests a buy you should buy the stock and hold. |

|
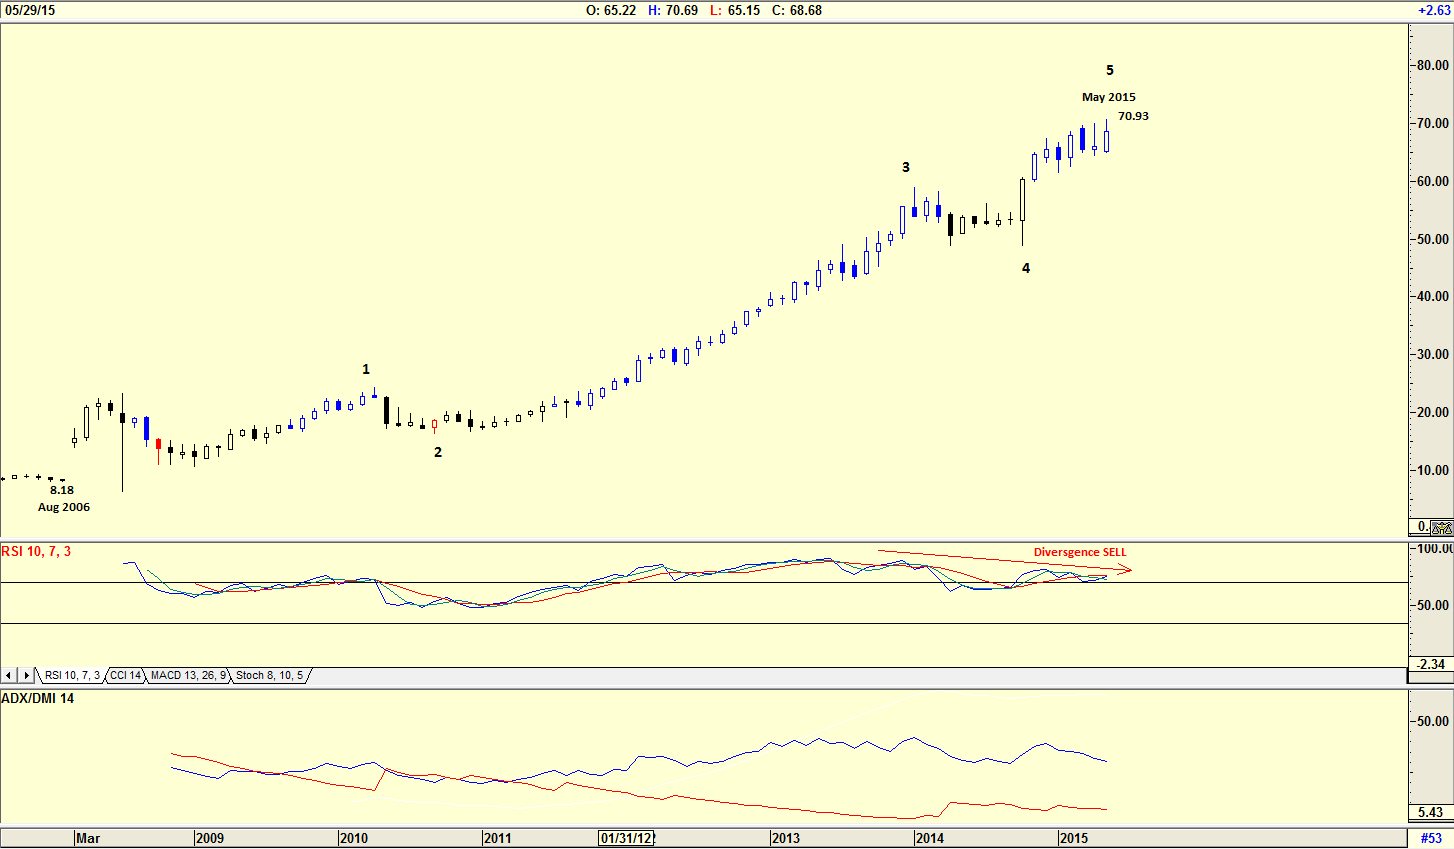
| Figure 3. Monthly Chart Of Visa Inc. (V). Could this stock be ripe for a pullback? |
| Graphic provided by: AdvancedGET. |
| |
| The chart in Figure 3 is a monthly chart of Visa, Inc. (V), another of Warren Buffett's interest bearing stocks. The chart shows how the price rose from $8.18 in August 2006 to its present high of $70.93. The RSI is suggesting a divergence sell signal. That is where the share price is making higher highs but the RSI is making lower highs. The ADX/DMI indicator is still in positive mode, and has not given a sell signal, that is, when the blue line falls below the red line shown. An Elliott wave count is suggesting the chart is in a Wave 5. |

|
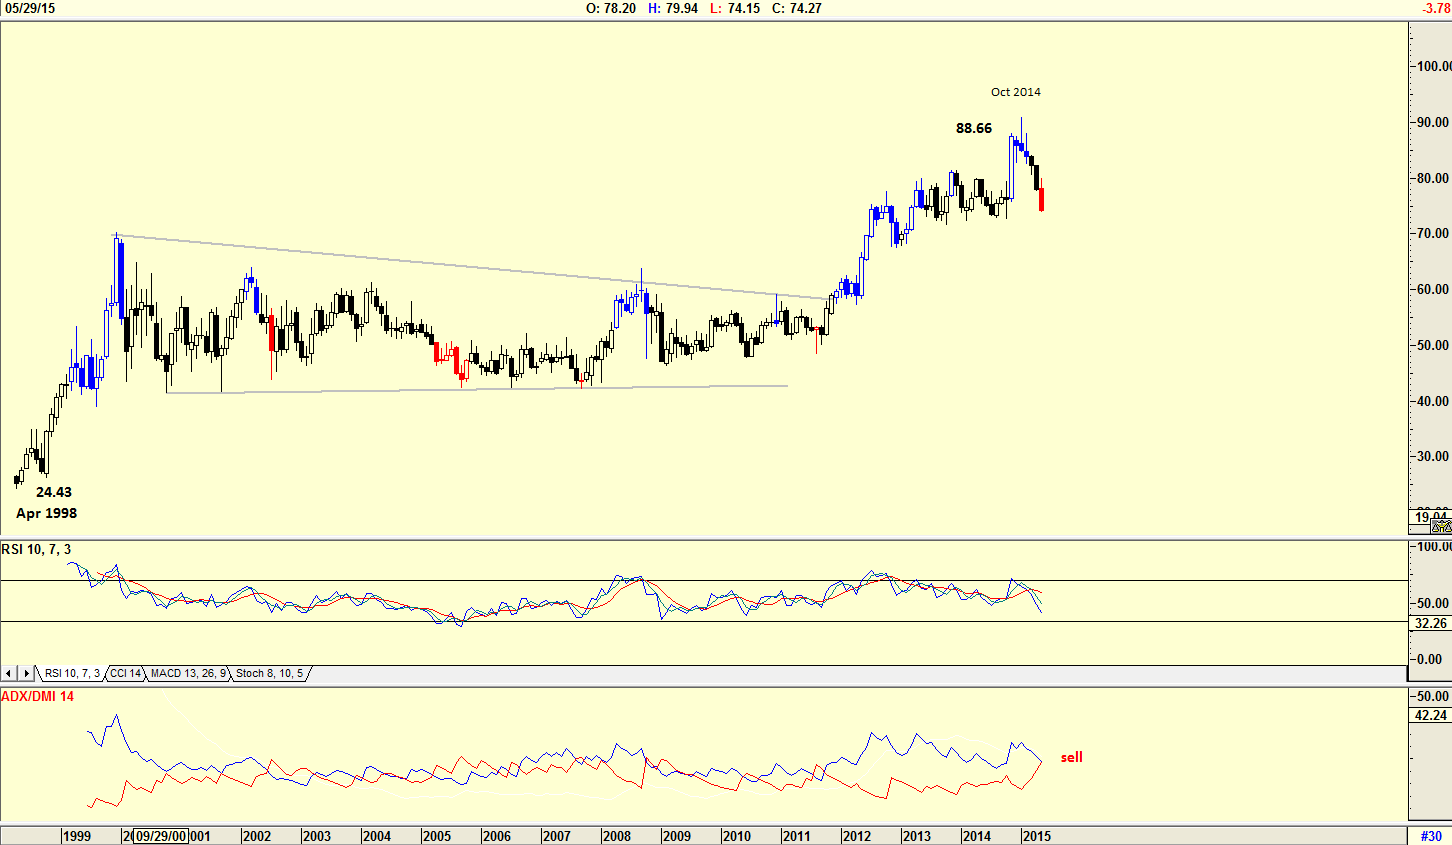
| Figure 4. Monthly Chart Of Wal-Mart Stores Inc. (WMT). Here's another solid dividend paying stock that is currently showing some weakness. |
| Graphic provided by: AdvancedGET. |
| |
| Figure 4 is a chart of Wal-Mart Stores Inc. (WMT), another solid dividend paying stock. Once again the RSI is suggesting weakness. The ADX/DMI indicator is also giving a sell signal, with the blue line crossing below the red line. The charts shown are only four of the many solid interest bearing stocks that Warren Buffett owns. His strategy — buy & hold as long as the company is sound and management meets his standards. The interest/dividends he has collected over the years have been greatly to his benefit. With the market presently correcting based on the "sell in May and go away" mantra, investors could look to buy these stocks and other interest bearing stocks for the long-long term "Warren Buffett" hold. |
Has been a technical analyst since 1969, and has worked as a futures and options trader with First Financial Futures in Johannesburg, South Africa.
| Address: | 3256 West 24th Ave |
| Vancouver, BC | |
| Phone # for sales: | 6042634214 |
| E-mail address: | petroosp@gmail.com |
Click here for more information about our publications!
PRINT THIS ARTICLE

Request Information From Our Sponsors
- StockCharts.com, Inc.
- Candle Patterns
- Candlestick Charting Explained
- Intermarket Technical Analysis
- John Murphy on Chart Analysis
- John Murphy's Chart Pattern Recognition
- John Murphy's Market Message
- MurphyExplainsMarketAnalysis-Intermarket Analysis
- MurphyExplainsMarketAnalysis-Visual Analysis
- StockCharts.com
- Technical Analysis of the Financial Markets
- The Visual Investor
- VectorVest, Inc.
- Executive Premier Workshop
- One-Day Options Course
- OptionsPro
- Retirement Income Workshop
- Sure-Fire Trading Systems (VectorVest, Inc.)
- Trading as a Business Workshop
- VectorVest 7 EOD
- VectorVest 7 RealTime/IntraDay
- VectorVest AutoTester
- VectorVest Educational Services
- VectorVest OnLine
- VectorVest Options Analyzer
- VectorVest ProGraphics v6.0
- VectorVest ProTrader 7
- VectorVest RealTime Derby Tool
- VectorVest Simulator
- VectorVest Variator
- VectorVest Watchdog
