

HOT TOPICS LIST
- MACD
- Fibonacci
- RSI
- Gann
- ADXR
- Stochastics
- Volume
- Triangles
- Futures
- Cycles
- Volatility
- ZIGZAG
- MESA
- Retracement
- Aroon
INDICATORS LIST
LIST OF TOPICS
PRINT THIS ARTICLE
by Donald W. Pendergast, Jr.
Shares of Avery Dennison Corp. have surged sharply since mid-April 2015, but now appear to be pausing and/or preparing for a correction.
Position: N/A
Donald W. Pendergast, Jr.
Freelance financial markets writer and online publisher of the Trendzetterz.com S&P 500 Weekly Forecast service.
PRINT THIS ARTICLE
CYCLES
AVY: Too Far, Too Fast?
06/04/15 01:32:06 PMby Donald W. Pendergast, Jr.
Shares of Avery Dennison Corp. have surged sharply since mid-April 2015, but now appear to be pausing and/or preparing for a correction.
Position: N/A
| Trading with cycles can often be profitable, but win or lose, there's just something fascinating about the inherently accurate forecasting ability involved with the primary cycles in large cap stocks. Here's an interesting tale of two cycles in Avery Dennison Corp. (AVY) on its weekly (Figure 1) and monthly (Figure 2) charts. |
|
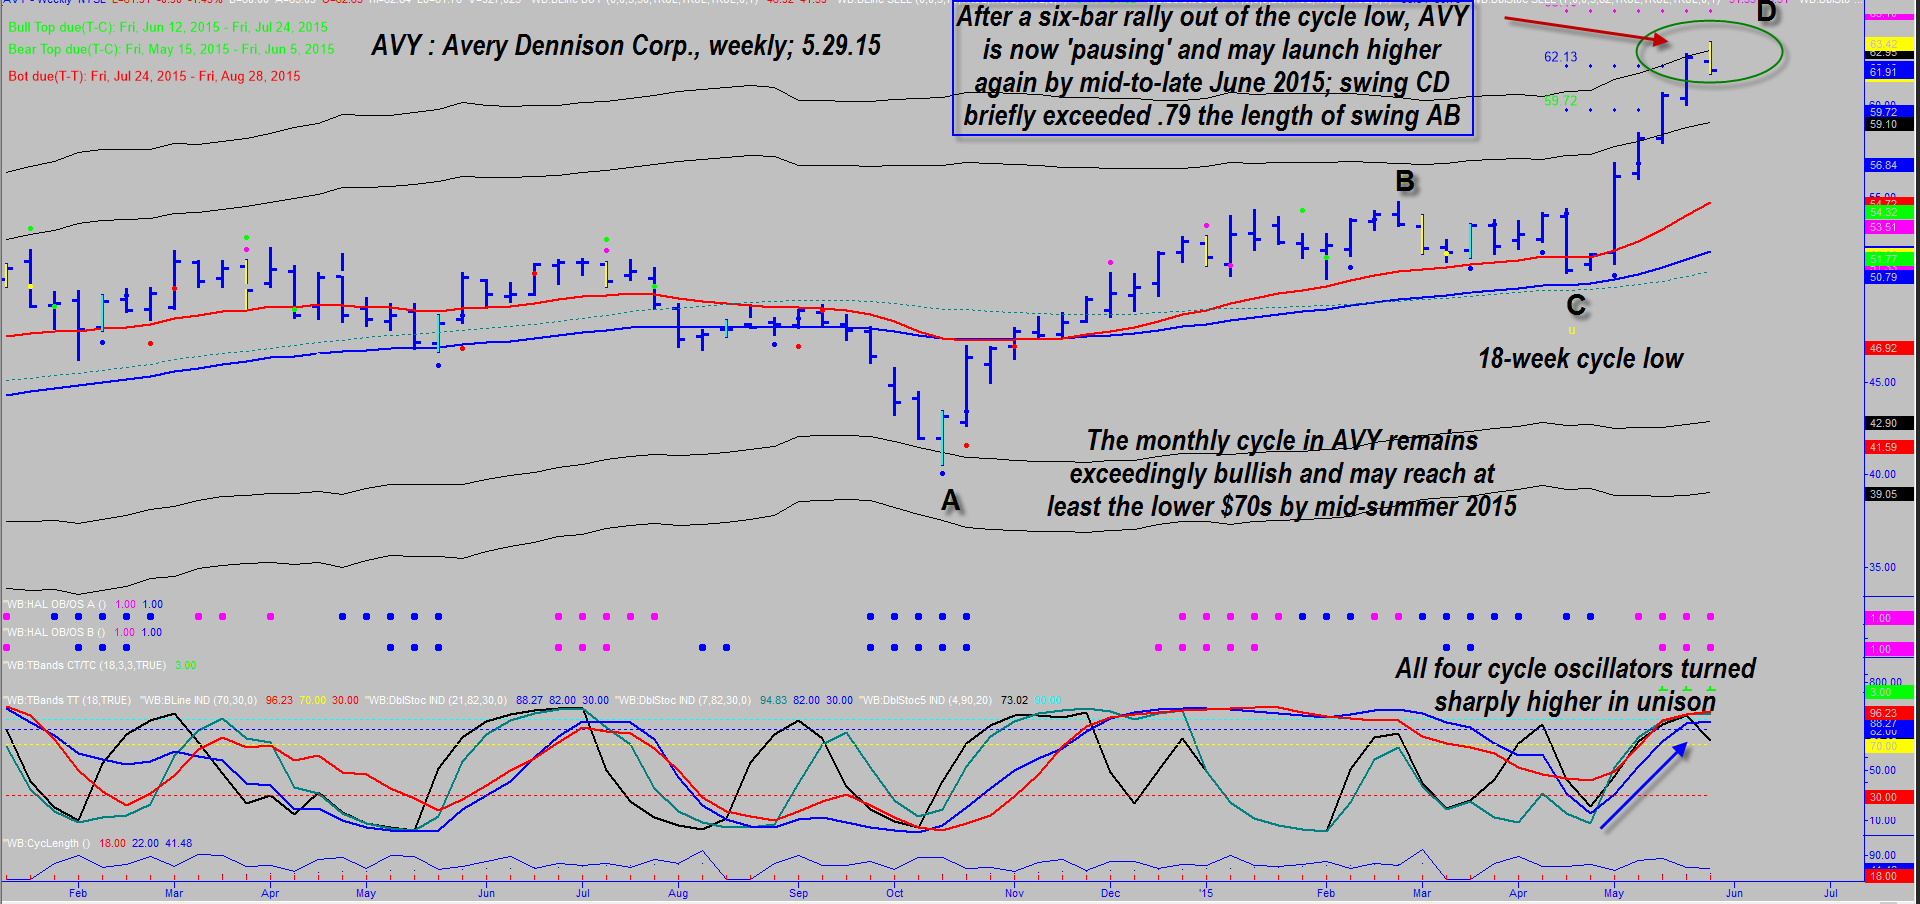
| Figure 1. Weekly Chart Of Avery Dennison Corp. (AVY). The stock may be experiencing mild exhaustion, going into a resting phase for the next one to three weeks before the dominant 18 week bullish cycle reasserts itself. |
| Graphic provided by: TradeStation. |
| Graphic provided by: ProfitTrader7 from www.walterbressert.com. |
| |
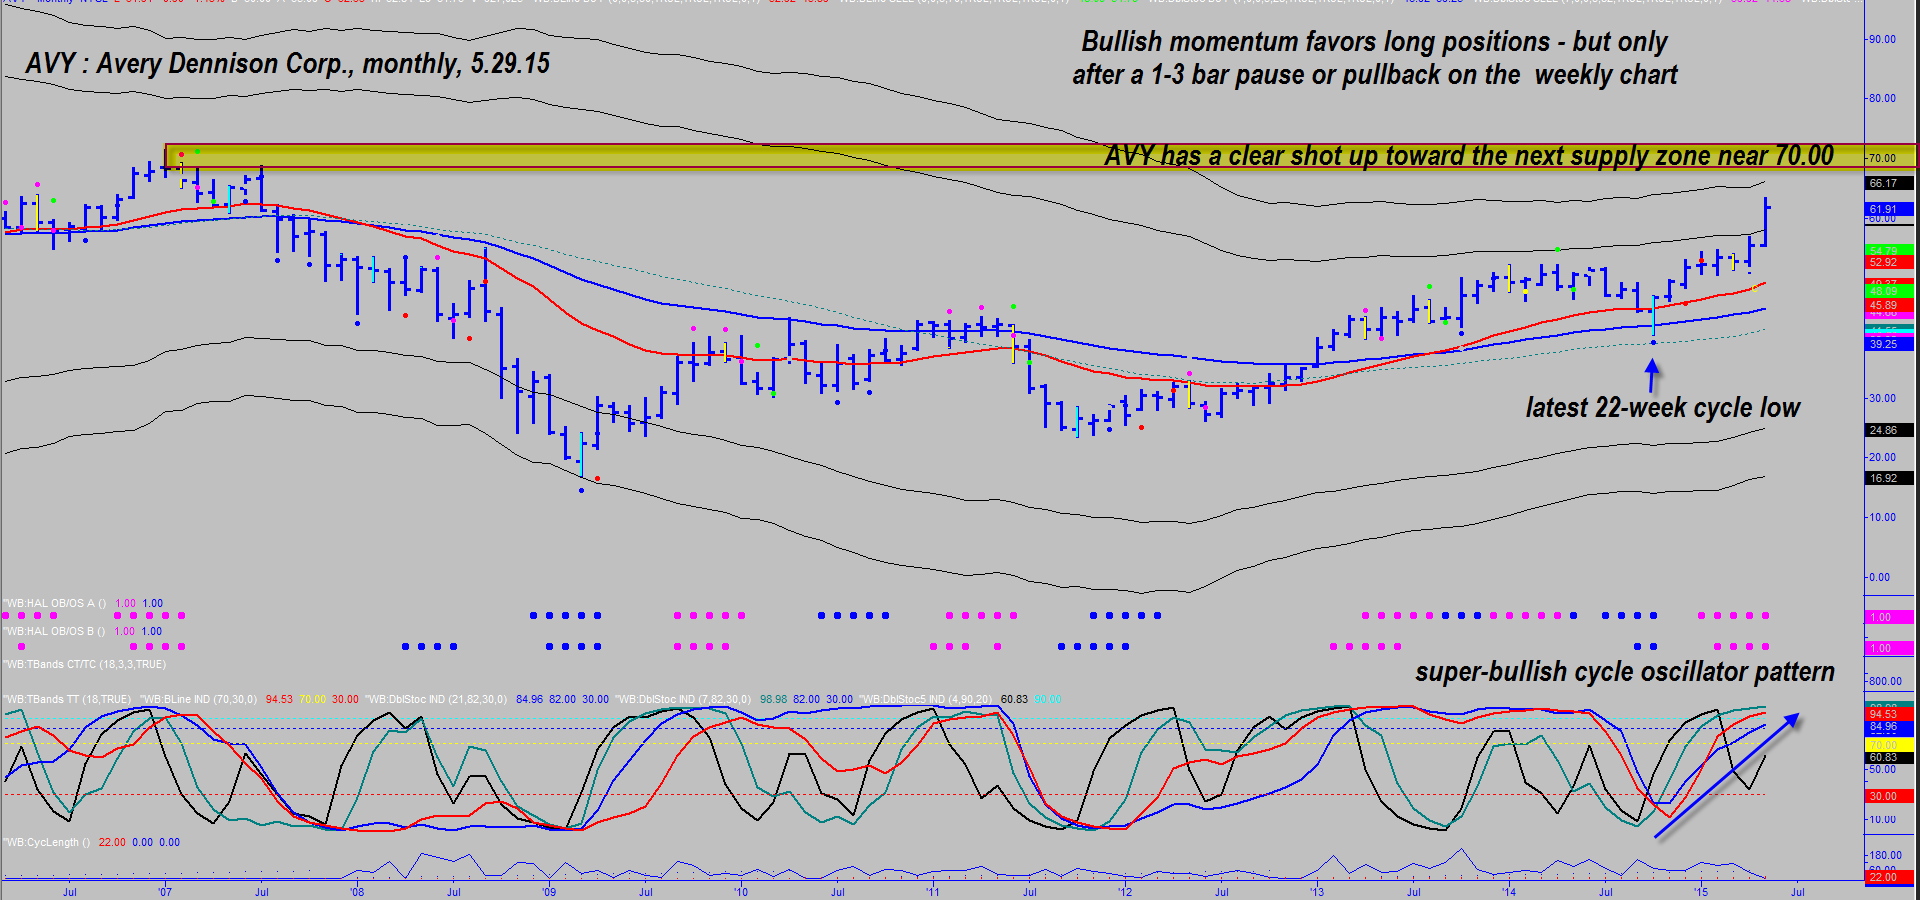
| AVY broke sharply higher in the latter part of April 2015, making a 26% surge in the next five weeks; the stock has a dominant 18-week trading cycle (trough to trough) and now appears to be making what famed cycles trader Walter Bressert dubbed a "mid-cycle pause" in the midst of a combined bullish weekly/monthly chart trend. Basically, the idea here is this: After a confirmed cycle low (when the higher time frame is in an uptrend) there may be a five to eight bar rally after which the half-cycle within the larger (in this case an 18-week cycle) peaks. Profit-taking occurs in this pause — which can also manifest as a mild, shallow pullback — and then if the trend is still destined to continue, the final up thrust of the primary cycle will commence. Based on this observation, it now appears that AVY is already in this resting phase of the cycle, and it may last for another one to three weeks until the recent highs are once again taken out and the stock finishes its ascent into the 18-week cycle high. Also of note is that swing CD has reached/exceeded its minimum 62%/79% price target (in relation to swing AB); this also lends credence to the idea of a mid-cycle pause. The stock also bumped up against the extreme upper Keltner band as it temporarily exhausted upside momentum. However, the monthly chart reveals a massively bullish longer-term view for AVY; the stock looks to have a clear shot at a run up to the next supply zone near 70.00. AVY's most recent monthly cycle low happened seven months back, and given that the stock has little resistance until 70.00 and that momentum continues to strengthen, it's quite possible that the stock could make it close to 70.00 by mid-summer 2015. |
|
| Figure 2. Monthly Chart. AVY has little in the way of overhead supply to impede its upward progress until about 69.00-70.00. The current cycle oscillator pattern is especially bullish; momentum is increasing steadily on this monthly time frame. |
| Graphic provided by: TradeStation. |
| Graphic provided by: ProfitTrader7 from www.walterbressert.com. |
| |
| Weekly cycles analysis reveals that AVY has a 70% probability of peaking by July 24, 2015 and a 95% probability of maxing out by late August/early September 2015. Until something drastic changes in AVY's trend/momentum situation, only long positions are favored for daily swing traders and weekly chart-based covered call traders; the key trigger to watch now is for the high at 63.42 to be taken out, which is the primary evidence that the bullish 18-week cycle is reasserting itself. However you choose to trade such a bullish breakout, keep your account risk small (1 to 2% max) and remember to trade wisely until we meet here again. |
Freelance financial markets writer and online publisher of the Trendzetterz.com S&P 500 Weekly Forecast service.
| Title: | Market consultant and writer |
| Company: | Trendzetterz |
| Address: | 81 Hickory Hollow Drive |
| Crossville, TN 38555 | |
| Phone # for sales: | 904-303-4814 |
| Website: | trendzetterz.com |
| E-mail address: | support@trendzetterz.com |
Traders' Resource Links | |
| Trendzetterz has not added any product or service information to TRADERS' RESOURCE. | |
Click here for more information about our publications!
Comments

Request Information From Our Sponsors
- StockCharts.com, Inc.
- Candle Patterns
- Candlestick Charting Explained
- Intermarket Technical Analysis
- John Murphy on Chart Analysis
- John Murphy's Chart Pattern Recognition
- John Murphy's Market Message
- MurphyExplainsMarketAnalysis-Intermarket Analysis
- MurphyExplainsMarketAnalysis-Visual Analysis
- StockCharts.com
- Technical Analysis of the Financial Markets
- The Visual Investor
- VectorVest, Inc.
- Executive Premier Workshop
- One-Day Options Course
- OptionsPro
- Retirement Income Workshop
- Sure-Fire Trading Systems (VectorVest, Inc.)
- Trading as a Business Workshop
- VectorVest 7 EOD
- VectorVest 7 RealTime/IntraDay
- VectorVest AutoTester
- VectorVest Educational Services
- VectorVest OnLine
- VectorVest Options Analyzer
- VectorVest ProGraphics v6.0
- VectorVest ProTrader 7
- VectorVest RealTime Derby Tool
- VectorVest Simulator
- VectorVest Variator
- VectorVest Watchdog